
|
Anglo American Plc (AAL.L) Avaliação DCF |
Totalmente Editável: Adapte-Se Às Suas Necessidades No Excel Ou Planilhas
Design Profissional: Modelos Confiáveis E Padrão Da Indústria
Pré-Construídos Para Uso Rápido E Eficiente
Compatível com MAC/PC, totalmente desbloqueado
Não É Necessária Experiência; Fácil De Seguir
Anglo American plc (AAL.L) Bundle
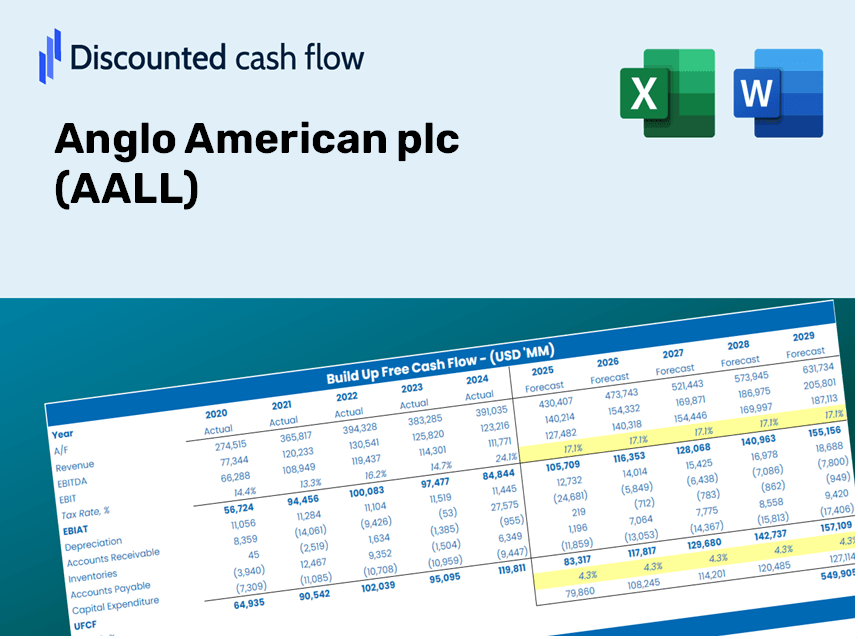
Projetado para precisão, a nossa calculadora DCF (Aall) capacita você a avaliar a avaliação da Anglo American PLC usando dados financeiros reais, juntamente com a flexibilidade de modificar todos os parâmetros principais para projeções aprimoradas.
Discounted Cash Flow (DCF) - (USD MM)
| Year | AY1 2020 |
AY2 2021 |
AY3 2022 |
AY4 2023 |
AY5 2024 |
FY1 2025 |
FY2 2026 |
FY3 2027 |
FY4 2028 |
FY5 2029 |
|---|---|---|---|---|---|---|---|---|---|---|
| Revenue | 19,373.4 | 31,636.1 | 26,736.2 | 23,336.1 | 20,776.6 | 22,029.5 | 23,358.0 | 24,766.7 | 26,260.3 | 27,843.9 |
| Revenue Growth, % | 0 | 63.3 | -15.49 | -12.72 | -10.97 | 6.03 | 6.03 | 6.03 | 6.03 | 6.03 |
| EBITDA | 6,560.3 | 15,017.9 | 9,472.4 | 5,534.8 | 2,527.6 | 6,725.4 | 7,131.0 | 7,561.1 | 8,017.0 | 8,500.5 |
| EBITDA, % | 33.86 | 47.47 | 35.43 | 23.72 | 12.17 | 30.53 | 30.53 | 30.53 | 30.53 | 30.53 |
| Depreciation | 1,977.2 | 2,067.0 | 1,862.2 | 2,044.2 | 2,338.8 | 1,926.3 | 2,042.5 | 2,165.6 | 2,296.2 | 2,434.7 |
| Depreciation, % | 10.21 | 6.53 | 6.97 | 8.76 | 11.26 | 8.74 | 8.74 | 8.74 | 8.74 | 8.74 |
| EBIT | 4,583.2 | 12,950.9 | 7,610.2 | 3,490.7 | 188.8 | 4,799.1 | 5,088.6 | 5,395.4 | 5,720.8 | 6,065.8 |
| EBIT, % | 23.66 | 40.94 | 28.46 | 14.96 | 0.90876 | 21.79 | 21.79 | 21.79 | 21.79 | 21.79 |
| Total Cash | 5,732.8 | 6,941.8 | 6,442.3 | 4,266.5 | 6,245.1 | 5,462.0 | 5,791.4 | 6,140.7 | 6,511.0 | 6,903.7 |
| Total Cash, percent | .0 | .0 | .0 | .0 | .0 | .0 | .0 | .0 | .0 | .0 |
| Account Receivables | 1,606.4 | 1,812.0 | 1,690.9 | 3,545.5 | 2,457.6 | 2,086.9 | 2,212.7 | 2,346.2 | 2,487.6 | 2,637.7 |
| Account Receivables, % | 8.29 | 5.73 | 6.32 | 15.19 | 11.83 | 9.47 | 9.47 | 9.47 | 9.47 | 9.47 |
| Inventories | 4,545.1 | 3,980.2 | 5,023.2 | 4,862.6 | 3,994.7 | 4,180.9 | 4,433.1 | 4,700.4 | 4,983.9 | 5,284.4 |
| Inventories, % | 23.46 | 12.58 | 18.79 | 20.84 | 19.23 | 18.98 | 18.98 | 18.98 | 18.98 | 18.98 |
| Accounts Payable | 5,094.8 | 6,037.3 | 5,618.6 | 4,957.0 | 4,638.0 | 4,844.8 | 5,137.0 | 5,446.7 | 5,775.2 | 6,123.5 |
| Accounts Payable, % | 26.3 | 19.08 | 21.01 | 21.24 | 22.32 | 21.99 | 21.99 | 21.99 | 21.99 | 21.99 |
| Capital Expenditure | -3,537.9 | -4,363.9 | -4,713.4 | -4,577.1 | -4,273.3 | -3,959.4 | -4,198.2 | -4,451.4 | -4,719.8 | -5,004.5 |
| Capital Expenditure, % | -18.26 | -13.79 | -17.63 | -19.61 | -20.57 | -17.97 | -17.97 | -17.97 | -17.97 | -17.97 |
| Tax Rate, % | -232.03 | -232.03 | -232.03 | -232.03 | -232.03 | -232.03 | -232.03 | -232.03 | -232.03 | -232.03 |
| EBITAT | 1,752.2 | 6,290.0 | 3,623.7 | 274.8 | 626.9 | 2,325.5 | 2,465.8 | 2,614.5 | 2,772.2 | 2,939.3 |
| Depreciation | ||||||||||
| Changes in Account Receivables | ||||||||||
| Changes in Inventories | ||||||||||
| Changes in Accounts Payable | ||||||||||
| Capital Expenditure | ||||||||||
| UFCF | -865.2 | 5,294.9 | -568.2 | -4,613.7 | 329.2 | 683.6 | 224.2 | 237.8 | 252.1 | 267.3 |
| WACC, % | 6.31 | 6.5 | 6.49 | 5.74 | 7.47 | 6.5 | 6.5 | 6.5 | 6.5 | 6.5 |
| PV UFCF | ||||||||||
| SUM PV UFCF | 1,427.4 | |||||||||
| Long Term Growth Rate, % | 0.50 | |||||||||
| Free cash flow (T + 1) | 269 | |||||||||
| Terminal Value | 4,476 | |||||||||
| Present Terminal Value | 3,267 | |||||||||
| Enterprise Value | 4,694 | |||||||||
| Net Debt | 7,646 | |||||||||
| Equity Value | -2,952 | |||||||||
| Diluted Shares Outstanding, MM | 1,212 | |||||||||
| Equity Value Per Share | -243.55 |
What You Will Receive
- Authentic Anglo American Data: Comprehensive financials – covering everything from revenue to EBIT – based on both actual and forecasted figures.
- Complete Customization: Modify all essential parameters (highlighted cells) such as WACC, growth %, and tax rates.
- Immediate Valuation Adjustments: Automatic recalculations to assess the effect of changes on the fair value of Anglo American plc (AALL).
- Flexible Excel Template: Designed for easy edits, scenario analysis, and in-depth projections.
- Efficient and Accurate: Avoid the hassle of building models from the ground up while ensuring both accuracy and adaptability.
Key Features
- Comprehensive DCF Calculator: Offers detailed unlevered and levered DCF valuation models tailored for Anglo American plc (AALL).
- WACC Calculator: Features a customizable Weighted Average Cost of Capital worksheet with adjustable inputs.
- Flexible Forecast Assumptions: Adapt growth rates, capital expenditures, and discount rates as needed.
- Integrated Financial Ratios: Assess profitability, leverage, and efficiency ratios specific to Anglo American plc (AALL).
- User-Friendly Dashboard and Charts: Visual representations of key valuation metrics for straightforward analysis.
How It Works
- Step 1: Download the prebuilt Excel template containing data for Anglo American plc (AALL).
- Step 2: Review the pre-filled worksheets to familiarize yourself with the essential metrics.
- Step 3: Modify the forecasts and assumptions in the editable yellow cells (WACC, growth, margins).
- Step 4: Instantly see the updated results, including the intrinsic value of Anglo American plc (AALL).
- Step 5: Utilize the outputs to make informed investment choices or to create detailed reports.
Why Choose the Anglo American plc (AALL) Calculator?
- Time-Efficient: Skip the hassle of building a DCF model from the ground up – it’s ready for immediate use.
- Enhanced Accuracy: Dependable financial data and formulas minimize valuation errors.
- Fully Adaptable: Customize the model to align with your specific assumptions and forecasts.
- User-Friendly: Intuitive charts and outputs make understanding the results straightforward.
- Preferred by Professionals: Crafted for experts who prioritize precision and functionality.
Who Can Benefit from This Product?
- Individual Investors: Make well-informed choices regarding the purchase or sale of Anglo American plc (AALL) shares.
- Financial Analysts: Enhance valuation workflows with pre-built financial models tailored for Anglo American plc (AALL).
- Consultants: Provide clients with timely and precise valuation insights on Anglo American plc (AALL).
- Business Owners: Gain an understanding of how major corporations like Anglo American plc (AALL) are valued to inform your strategic decisions.
- Finance Students: Acquire valuation skills by analyzing real-world data and case studies related to Anglo American plc (AALL).
Contents of the Template
- Operating and Balance Sheet Data: Pre-filled historical data and forecasts for Anglo American plc (AALL), which includes revenue, EBITDA, EBIT, and capital expenditures.
- WACC Calculation: A dedicated sheet for calculating the Weighted Average Cost of Capital (WACC), featuring parameters such as Beta, risk-free rate, and share price.
- DCF Valuation (Unlevered and Levered): Customizable Discounted Cash Flow models that present intrinsic value along with comprehensive calculations.
- Financial Statements: Pre-loaded annual and quarterly financial statements to facilitate thorough analysis.
- Key Ratios: Includes crucial profitability, leverage, and efficiency ratios relevant to Anglo American plc (AALL).
- Dashboard and Charts: Visual representation of valuation outputs and assumptions for easy result analysis.
Disclaimer
All information, articles, and product details provided on this website are for general informational and educational purposes only. We do not claim any ownership over, nor do we intend to infringe upon, any trademarks, copyrights, logos, brand names, or other intellectual property mentioned or depicted on this site. Such intellectual property remains the property of its respective owners, and any references here are made solely for identification or informational purposes, without implying any affiliation, endorsement, or partnership.
We make no representations or warranties, express or implied, regarding the accuracy, completeness, or suitability of any content or products presented. Nothing on this website should be construed as legal, tax, investment, financial, medical, or other professional advice. In addition, no part of this site—including articles or product references—constitutes a solicitation, recommendation, endorsement, advertisement, or offer to buy or sell any securities, franchises, or other financial instruments, particularly in jurisdictions where such activity would be unlawful.
All content is of a general nature and may not address the specific circumstances of any individual or entity. It is not a substitute for professional advice or services. Any actions you take based on the information provided here are strictly at your own risk. You accept full responsibility for any decisions or outcomes arising from your use of this website and agree to release us from any liability in connection with your use of, or reliance upon, the content or products found herein.