
|
Airbnb, Inc. (ABNB) Avaliação DCF |
Totalmente Editável: Adapte-Se Às Suas Necessidades No Excel Ou Planilhas
Design Profissional: Modelos Confiáveis E Padrão Da Indústria
Pré-Construídos Para Uso Rápido E Eficiente
Compatível com MAC/PC, totalmente desbloqueado
Não É Necessária Experiência; Fácil De Seguir
Airbnb, Inc. (ABNB) Bundle
Otimize seu tempo e melhore a precisão com nossa calculadora [ABNB] DCF! Equipado com dados reais do Airbnb e suposições personalizáveis, essa ferramenta o capacita a prever, analisar e valorizar a Airbnb, Inc. como um investidor especialista.
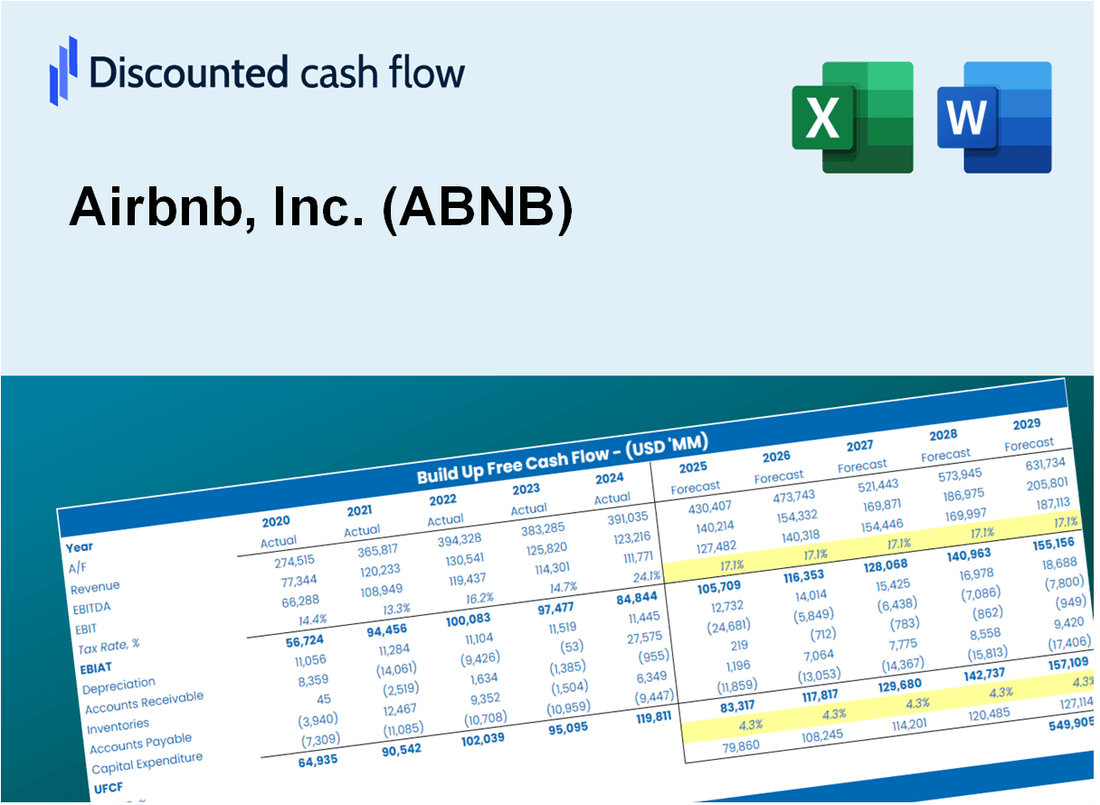
Discounted Cash Flow (DCF) - (USD MM)
| Year | AY1 2020 |
AY2 2021 |
AY3 2022 |
AY4 2023 |
AY5 2024 |
FY1 2025 |
FY2 2026 |
FY3 2027 |
FY4 2028 |
FY5 2029 |
|---|---|---|---|---|---|---|---|---|---|---|
| Revenue | 3,378.2 | 5,992.0 | 8,399.0 | 9,917.0 | 11,102.0 | 15,197.7 | 20,804.3 | 28,479.3 | 38,985.7 | 53,368.1 |
| Revenue Growth, % | 0 | 77.37 | 40.17 | 18.07 | 11.95 | 36.89 | 36.89 | 36.89 | 36.89 | 36.89 |
| EBITDA | -4,384.4 | 276.0 | 1,972.0 | 1,562.0 | 2,618.0 | -990.4 | -1,355.7 | -1,855.9 | -2,540.5 | -3,477.8 |
| EBITDA, % | -129.78 | 4.61 | 23.48 | 15.75 | 23.58 | -6.52 | -6.52 | -6.52 | -6.52 | -6.52 |
| Depreciation | 125.9 | 138.0 | 81.0 | 44.0 | 65.0 | 243.9 | 333.8 | 457.0 | 625.5 | 856.3 |
| Depreciation, % | 3.73 | 2.3 | 0.9644 | 0.44368 | 0.58548 | 1.6 | 1.6 | 1.6 | 1.6 | 1.6 |
| EBIT | -4,510.3 | 138.0 | 1,891.0 | 1,518.0 | 2,553.0 | -1,121.0 | -1,534.5 | -2,100.6 | -2,875.5 | -3,936.4 |
| EBIT, % | -133.51 | 2.3 | 22.51 | 15.31 | 23 | -7.38 | -7.38 | -7.38 | -7.38 | -7.38 |
| Total Cash | 6,391.3 | 8,322.0 | 9,622.0 | 10,071.0 | 10,611.0 | 15,063.3 | 20,620.3 | 28,227.4 | 38,640.9 | 52,896.1 |
| Total Cash, percent | .0 | .0 | .0 | .0 | .0 | .0 | .0 | .0 | .0 | .0 |
| Account Receivables | 2,181.3 | 3,715.0 | 4,983.0 | 6,074.0 | 6,078.0 | 9,176.2 | 12,561.4 | 17,195.5 | 23,539.1 | 32,223.0 |
| Account Receivables, % | 64.57 | 62 | 59.33 | 61.25 | 54.75 | 60.38 | 60.38 | 60.38 | 60.38 | 60.38 |
| Inventories | .0 | .0 | .0 | .0 | .0 | .0 | .0 | .0 | .0 | .0 |
| Inventories, % | 0 | 0 | 0 | 0 | 0 | 0 | 0 | 0 | 0 | 0 |
| Accounts Payable | 79.9 | 118.0 | 137.0 | 141.0 | 142.0 | 263.4 | 360.6 | 493.6 | 675.7 | 925.0 |
| Accounts Payable, % | 2.37 | 1.97 | 1.63 | 1.42 | 1.28 | 1.73 | 1.73 | 1.73 | 1.73 | 1.73 |
| Capital Expenditure | -37.4 | .0 | -25.0 | .0 | .0 | -42.7 | -58.4 | -80.0 | -109.5 | -149.8 |
| Capital Expenditure, % | -1.11 | 0 | -0.29765 | 0 | 0 | -0.28078 | -0.28078 | -0.28078 | -0.28078 | -0.28078 |
| Tax Rate, % | 20.5 | 20.5 | 20.5 | 20.5 | 20.5 | 20.5 | 20.5 | 20.5 | 20.5 | 20.5 |
| EBITAT | -4,416.6 | 161.9 | 1,799.7 | 3,460.6 | 2,029.5 | -1,059.5 | -1,450.4 | -1,985.5 | -2,717.9 | -3,720.6 |
| Depreciation | ||||||||||
| Changes in Account Receivables | ||||||||||
| Changes in Inventories | ||||||||||
| Changes in Accounts Payable | ||||||||||
| Capital Expenditure | ||||||||||
| UFCF | -6,429.5 | -1,195.6 | 606.7 | 2,417.6 | 2,091.5 | -3,835.1 | -4,463.0 | -6,109.5 | -8,363.4 | -11,448.8 |
| WACC, % | 8.68 | 8.68 | 8.68 | 8.68 | 8.66 | 8.68 | 8.68 | 8.68 | 8.68 | 8.68 |
| PV UFCF | ||||||||||
| SUM PV UFCF | -25,616.6 | |||||||||
| Long Term Growth Rate, % | 4.00 | |||||||||
| Free cash flow (T + 1) | -11,907 | |||||||||
| Terminal Value | -254,674 | |||||||||
| Present Terminal Value | -168,008 | |||||||||
| Enterprise Value | -193,625 | |||||||||
| Net Debt | -4,570 | |||||||||
| Equity Value | -189,055 | |||||||||
| Diluted Shares Outstanding, MM | 645 | |||||||||
| Equity Value Per Share | -293.11 |
What You Will Get
- Real ABNB Financial Data: Pre-filled with Airbnb’s historical and projected data for precise analysis.
- Fully Editable Template: Modify key inputs like revenue growth, WACC, and EBITDA % with ease.
- Automatic Calculations: See Airbnb’s intrinsic value update instantly based on your changes.
- Professional Valuation Tool: Designed for investors, analysts, and consultants seeking accurate DCF results.
- User-Friendly Design: Simple structure and clear instructions for all experience levels.
Key Features
- 🔍 Real-Life ABNB Financials: Pre-filled historical and projected data for Airbnb, Inc.
- ✏️ Fully Customizable Inputs: Adjust all critical parameters (yellow cells) like WACC, growth %, and tax rates.
- 📊 Professional DCF Valuation: Built-in formulas calculate Airbnb’s intrinsic value using the Discounted Cash Flow method.
- ⚡ Instant Results: Visualize Airbnb’s valuation instantly after making changes.
- Scenario Analysis: Test and compare outcomes for various financial assumptions side-by-side.
How It Works
- Step 1: Download the Excel file.
- Step 2: Review Airbnb’s pre-filled financial data and forecasts.
- Step 3: Modify key inputs such as occupancy rates, pricing strategies, and operational costs (highlighted cells).
- Step 4: Observe the DCF model update in real-time as you adjust your assumptions.
- Step 5: Analyze the outputs and leverage the results for your investment strategies.
Why Choose This Calculator?
- User-Friendly Interface: Perfect for both newcomers and seasoned users.
- Customizable Inputs: Adjust parameters easily to suit your financial analysis.
- Real-Time Valuation: Watch Airbnb’s valuation change instantly as you modify inputs.
- Pre-Loaded Data: Comes with Airbnb’s actual financial metrics for swift assessments.
- Preferred by Experts: Utilized by investors and analysts for making well-informed choices.
Who Should Use This Product?
- Travel Enthusiasts: Explore pricing strategies and market trends using real-time data.
- Researchers: Integrate industry benchmarks into academic studies or projects.
- Real Estate Investors: Evaluate your investment strategies and assess valuation metrics for Airbnb, Inc. (ABNB).
- Market Analysts: Enhance your analysis with a customizable model tailored for short-term rental markets.
- Property Managers: Understand how major players like Airbnb, Inc. (ABNB) operate and impact the rental landscape.
What the Template Contains
- Preloaded ABNB Data: Historical and projected financial data, including revenue, EBIT, and capital expenditures.
- DCF and WACC Models: Professional-grade sheets for calculating intrinsic value and Weighted Average Cost of Capital.
- Editable Inputs: Yellow-highlighted cells for adjusting revenue growth, tax rates, and discount rates.
- Financial Statements: Comprehensive annual and quarterly financials for deeper analysis.
- Key Ratios: Profitability, leverage, and efficiency ratios to evaluate performance.
- Dashboard and Charts: Visual summaries of valuation outcomes and assumptions.
Disclaimer
All information, articles, and product details provided on this website are for general informational and educational purposes only. We do not claim any ownership over, nor do we intend to infringe upon, any trademarks, copyrights, logos, brand names, or other intellectual property mentioned or depicted on this site. Such intellectual property remains the property of its respective owners, and any references here are made solely for identification or informational purposes, without implying any affiliation, endorsement, or partnership.
We make no representations or warranties, express or implied, regarding the accuracy, completeness, or suitability of any content or products presented. Nothing on this website should be construed as legal, tax, investment, financial, medical, or other professional advice. In addition, no part of this site—including articles or product references—constitutes a solicitation, recommendation, endorsement, advertisement, or offer to buy or sell any securities, franchises, or other financial instruments, particularly in jurisdictions where such activity would be unlawful.
All content is of a general nature and may not address the specific circumstances of any individual or entity. It is not a substitute for professional advice or services. Any actions you take based on the information provided here are strictly at your own risk. You accept full responsibility for any decisions or outcomes arising from your use of this website and agree to release us from any liability in connection with your use of, or reliance upon, the content or products found herein.