
|
ACI Worldwide, Inc. (ACIW) Avaliação DCF |
Totalmente Editável: Adapte-Se Às Suas Necessidades No Excel Ou Planilhas
Design Profissional: Modelos Confiáveis E Padrão Da Indústria
Pré-Construídos Para Uso Rápido E Eficiente
Compatível com MAC/PC, totalmente desbloqueado
Não É Necessária Experiência; Fácil De Seguir
ACI Worldwide, Inc. (ACIW) Bundle
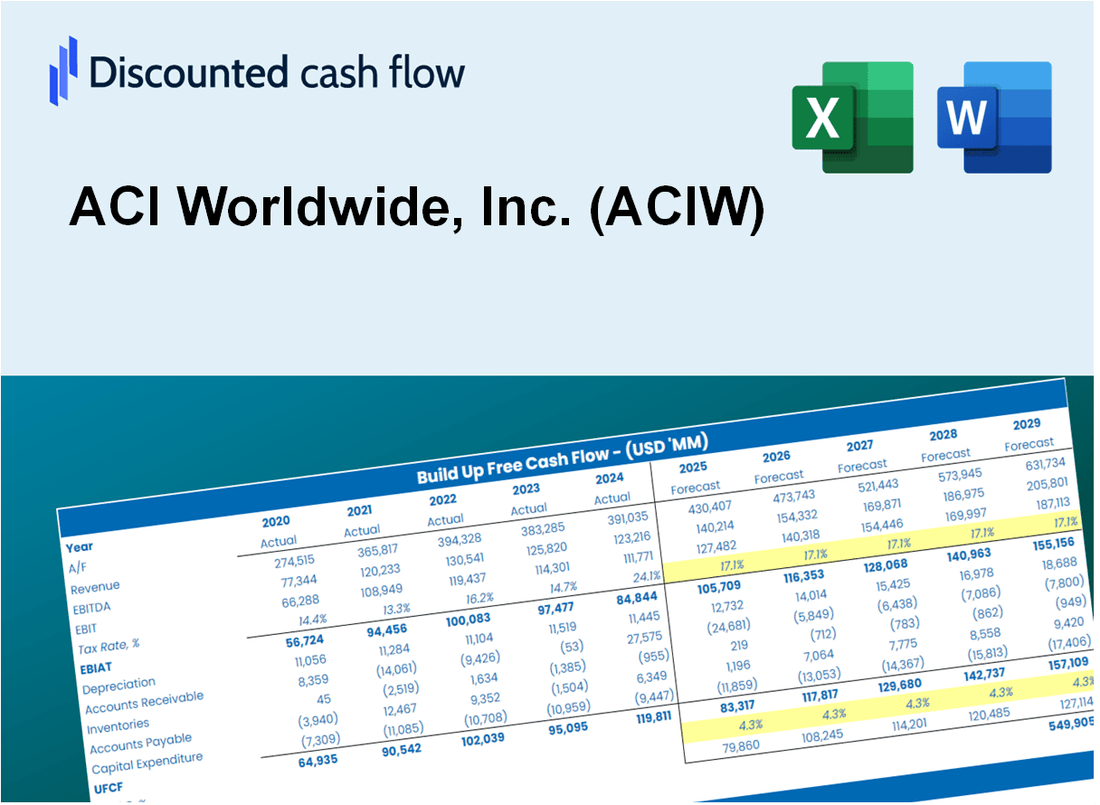
Obtenha uma visão da sua análise de avaliação da ACI Worldwide, Inc. (ACIW) com nossa calculadora DCF de ponta! Pré -carregado com dados reais da ACIW, este modelo do Excel permite ajustar as previsões e suposições para determinar o valor intrínseco da ACI Worldwide, Inc. (ACIW) com precisão.
Discounted Cash Flow (DCF) - (USD MM)
| Year | AY1 2020 |
AY2 2021 |
AY3 2022 |
AY4 2023 |
AY5 2024 |
FY1 2025 |
FY2 2026 |
FY3 2027 |
FY4 2028 |
FY5 2029 |
|---|---|---|---|---|---|---|---|---|---|---|
| Revenue | 1,294.3 | 1,370.6 | 1,421.9 | 1,452.6 | 1,594.3 | 1,680.2 | 1,770.7 | 1,866.1 | 1,966.6 | 2,072.6 |
| Revenue Growth, % | 0 | 5.89 | 3.74 | 2.16 | 9.76 | 5.39 | 5.39 | 5.39 | 5.39 | 5.39 |
| EBITDA | 319.0 | 364.0 | 398.2 | 360.1 | 443.5 | 443.0 | 466.8 | 492.0 | 518.5 | 546.4 |
| EBITDA, % | 24.65 | 26.56 | 28 | 24.79 | 27.82 | 26.36 | 26.36 | 26.36 | 26.36 | 26.36 |
| Depreciation | 163.8 | 143.9 | 138.4 | 134.0 | 120.7 | 166.9 | 175.9 | 185.4 | 195.4 | 205.9 |
| Depreciation, % | 12.65 | 10.5 | 9.73 | 9.22 | 7.57 | 9.94 | 9.94 | 9.94 | 9.94 | 9.94 |
| EBIT | 155.3 | 220.1 | 259.8 | 226.1 | 322.9 | 276.0 | 290.9 | 306.6 | 323.1 | 340.5 |
| EBIT, % | 12 | 16.06 | 18.27 | 15.57 | 20.25 | 16.43 | 16.43 | 16.43 | 16.43 | 16.43 |
| Total Cash | 165.4 | 122.1 | 125.0 | 164.2 | 216.4 | 186.0 | 196.0 | 206.6 | 217.7 | 229.4 |
| Total Cash, percent | .0 | .0 | .0 | .0 | .0 | .0 | .0 | .0 | .0 | .0 |
| Account Receivables | 342.9 | 320.4 | 403.8 | 452.3 | 414.4 | 455.0 | 479.5 | 505.3 | 532.6 | 561.2 |
| Account Receivables, % | 26.49 | 23.38 | 28.4 | 31.14 | 25.99 | 27.08 | 27.08 | 27.08 | 27.08 | 27.08 |
| Inventories | .0 | .0 | .0 | .0 | .0 | .0 | .0 | .0 | .0 | .0 |
| Inventories, % | 0 | 0 | 0 | 0 | 0 | 0 | 0 | 0 | 0 | 0 |
| Accounts Payable | 41.2 | 41.3 | 48.0 | 46.0 | 45.4 | 52.4 | 55.2 | 58.2 | 61.3 | 64.6 |
| Accounts Payable, % | 3.18 | 3.01 | 3.38 | 3.16 | 2.85 | 3.12 | 3.12 | 3.12 | 3.12 | 3.12 |
| Capital Expenditure | -46.6 | -45.4 | -39.9 | -37.8 | -15.4 | -44.6 | -47.0 | -49.6 | -52.3 | -55.1 |
| Capital Expenditure, % | -3.6 | -3.31 | -2.81 | -2.6 | -0.96607 | -2.66 | -2.66 | -2.66 | -2.66 | -2.66 |
| Tax Rate, % | 18.89 | 18.89 | 18.89 | 18.89 | 18.89 | 18.89 | 18.89 | 18.89 | 18.89 | 18.89 |
| EBITAT | 114.4 | 160.7 | 178.8 | 186.1 | 261.9 | 209.2 | 220.5 | 232.3 | 244.8 | 258.0 |
| Depreciation | ||||||||||
| Changes in Account Receivables | ||||||||||
| Changes in Inventories | ||||||||||
| Changes in Accounts Payable | ||||||||||
| Capital Expenditure | ||||||||||
| UFCF | -70.1 | 281.8 | 200.6 | 231.7 | 404.6 | 297.8 | 327.6 | 345.3 | 363.9 | 383.5 |
| WACC, % | 8.35 | 8.34 | 8.29 | 8.45 | 8.44 | 8.37 | 8.37 | 8.37 | 8.37 | 8.37 |
| PV UFCF | ||||||||||
| SUM PV UFCF | 1,345.5 | |||||||||
| Long Term Growth Rate, % | 3.50 | |||||||||
| Free cash flow (T + 1) | 397 | |||||||||
| Terminal Value | 8,146 | |||||||||
| Present Terminal Value | 5,450 | |||||||||
| Enterprise Value | 6,795 | |||||||||
| Net Debt | 740 | |||||||||
| Equity Value | 6,055 | |||||||||
| Diluted Shares Outstanding, MM | 106 | |||||||||
| Equity Value Per Share | 56.86 |
What You Will Receive
- Pre-Filled Financial Model: ACI Worldwide’s actual data facilitates accurate DCF valuation.
- Comprehensive Forecast Control: Modify revenue growth, profit margins, WACC, and other essential metrics.
- Real-Time Calculations: Automatic updates provide immediate feedback as you adjust inputs.
- Professional-Grade Template: An optimized Excel file crafted for high-quality valuation.
- Flexible and Reusable: Designed for adaptability, allowing for repeated use in detailed financial projections.
Key Features
- Comprehensive DCF Calculator: Offers detailed unlevered and levered DCF valuation models tailored for ACI Worldwide, Inc. (ACIW).
- WACC Calculator: Features a pre-built Weighted Average Cost of Capital sheet with adjustable inputs specific to ACI Worldwide, Inc. (ACIW).
- Customizable Forecast Assumptions: Easily modify growth projections, capital expenditures, and discount rates for ACI Worldwide, Inc. (ACIW).
- Integrated Financial Ratios: Evaluate profitability, leverage, and efficiency ratios relevant to ACI Worldwide, Inc. (ACIW).
- Interactive Dashboard and Charts: Visual representations summarize essential valuation metrics for straightforward analysis of ACI Worldwide, Inc. (ACIW).
How It Works
- Step 1: Download the Excel file.
- Step 2: Review pre-entered ACI Worldwide data (historical and projected).
- Step 3: Adjust key assumptions (yellow cells) based on your analysis.
- Step 4: View automatic recalculations for ACI Worldwide’s intrinsic value.
- Step 5: Use the outputs for investment decisions or reporting.
Why Choose ACI Worldwide, Inc. (ACIW)?
- Time Efficiency: Quickly access payment solutions without the hassle of extensive setup.
- Enhanced Accuracy: Utilize trustworthy data and algorithms to minimize errors in transaction processing.
- Completely Customizable: Adjust the solutions to match your specific business needs and objectives.
- User-Friendly: Intuitive interfaces and visualizations simplify the analysis of payment data.
- Respected by Professionals: Preferred by industry leaders who prioritize reliability and functionality.
Who Should Use This Product?
- Professional Investors: Develop comprehensive and accurate valuation models for analyzing ACI Worldwide, Inc. (ACIW) investments.
- Corporate Finance Teams: Evaluate valuation scenarios to inform strategic decisions within the organization.
- Consultants and Advisors: Deliver precise valuation insights to clients regarding ACI Worldwide, Inc. (ACIW).
- Students and Educators: Utilize real-world data to enhance learning and practice in financial modeling.
- Tech Enthusiasts: Gain insights into how technology companies like ACI Worldwide, Inc. (ACIW) are assessed in the financial markets.
What the Template Contains
- Historical Data: Includes ACI Worldwide, Inc.'s (ACIW) past financials and baseline forecasts.
- DCF and Levered DCF Models: Detailed templates to calculate ACI Worldwide, Inc.'s (ACIW) intrinsic value.
- WACC Sheet: Pre-built calculations for Weighted Average Cost of Capital.
- Editable Inputs: Modify key drivers like growth rates, EBITDA %, and CAPEX assumptions.
- Quarterly and Annual Statements: A complete breakdown of ACI Worldwide, Inc.'s (ACIW) financials.
- Interactive Dashboard: Visualize valuation results and projections dynamically.
Disclaimer
All information, articles, and product details provided on this website are for general informational and educational purposes only. We do not claim any ownership over, nor do we intend to infringe upon, any trademarks, copyrights, logos, brand names, or other intellectual property mentioned or depicted on this site. Such intellectual property remains the property of its respective owners, and any references here are made solely for identification or informational purposes, without implying any affiliation, endorsement, or partnership.
We make no representations or warranties, express or implied, regarding the accuracy, completeness, or suitability of any content or products presented. Nothing on this website should be construed as legal, tax, investment, financial, medical, or other professional advice. In addition, no part of this site—including articles or product references—constitutes a solicitation, recommendation, endorsement, advertisement, or offer to buy or sell any securities, franchises, or other financial instruments, particularly in jurisdictions where such activity would be unlawful.
All content is of a general nature and may not address the specific circumstances of any individual or entity. It is not a substitute for professional advice or services. Any actions you take based on the information provided here are strictly at your own risk. You accept full responsibility for any decisions or outcomes arising from your use of this website and agree to release us from any liability in connection with your use of, or reliance upon, the content or products found herein.