|
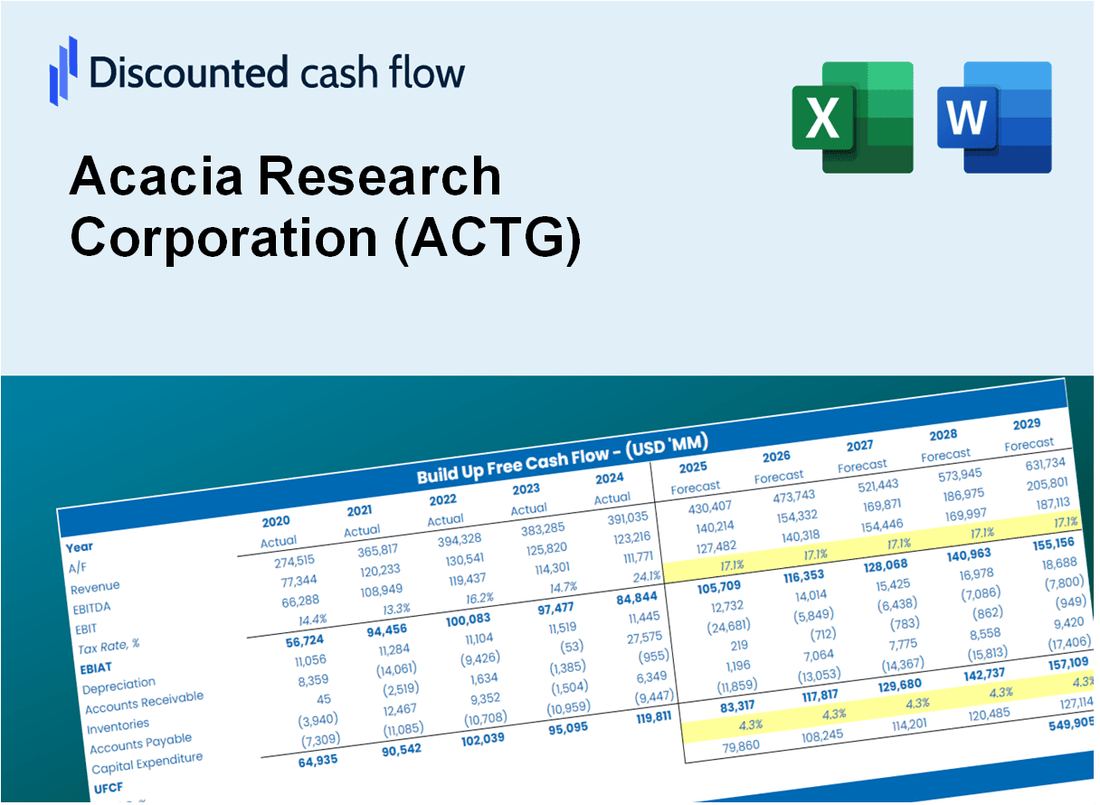
Avaliação DCF da Acacia Research Corporation (ACTG) |
Totalmente Editável: Adapte-Se Às Suas Necessidades No Excel Ou Planilhas
Design Profissional: Modelos Confiáveis E Padrão Da Indústria
Pré-Construídos Para Uso Rápido E Eficiente
Compatível com MAC/PC, totalmente desbloqueado
Não É Necessária Experiência; Fácil De Seguir
Acacia Research Corporation (ACTG) Bundle
Revelar o verdadeiro potencial da Acacia Research Corporation (ACTG) com nossa calculadora avançada de DCF! Ajuste as suposições críticas, explore vários cenários e avalie como as modificações afetam a avaliação da Acacia Research Corporation (ACTG) - tudo dentro de um único modelo do Excel.
Discounted Cash Flow (DCF) - (USD MM)
| Year | AY1 2020 |
AY2 2021 |
AY3 2022 |
AY4 2023 |
AY5 2024 |
FY1 2025 |
FY2 2026 |
FY3 2027 |
FY4 2028 |
FY5 2029 |
|---|---|---|---|---|---|---|---|---|---|---|
| Revenue | 29.8 | 88.0 | 59.2 | 125.1 | 122.3 | 172.8 | 244.1 | 344.8 | 487.0 | 687.9 |
| Revenue Growth, % | 0 | 195.64 | -32.74 | 111.24 | -2.23 | 41.26 | 41.26 | 41.26 | 41.26 | 41.26 |
| EBITDA | 123.0 | 193.3 | -107.2 | 84.3 | 2.9 | 58.7 | 82.9 | 117.0 | 165.3 | 233.5 |
| EBITDA, % | 413.03 | 219.5 | -181.02 | 67.41 | 2.33 | 33.95 | 33.95 | 33.95 | 33.95 | 33.95 |
| Depreciation | 4.8 | 10.7 | 13.5 | 15.0 | 34.6 | 31.5 | 44.6 | 63.0 | 88.9 | 125.6 |
| Depreciation, % | 16.12 | 12.14 | 22.82 | 11.97 | 28.26 | 18.26 | 18.26 | 18.26 | 18.26 | 18.26 |
| EBIT | 118.2 | 182.6 | -120.7 | 69.4 | -31.7 | 44.8 | 63.2 | 89.3 | 126.1 | 178.2 |
| EBIT, % | 396.91 | 207.36 | -203.84 | 55.44 | -25.92 | 25.9 | 25.9 | 25.9 | 25.9 | 25.9 |
| Total Cash | 451.3 | 707.5 | 386.1 | 439.9 | 333.8 | 172.8 | 244.1 | 344.8 | 487.0 | 687.9 |
| Total Cash, percent | .0 | .0 | .0 | .0 | .0 | .0 | .0 | .0 | .0 | .0 |
| Account Receivables | .5 | 9.5 | 8.2 | 80.6 | 26.9 | 39.0 | 55.1 | 77.8 | 109.9 | 155.2 |
| Account Receivables, % | 1.7 | 10.81 | 13.9 | 64.39 | 22 | 22.56 | 22.56 | 22.56 | 22.56 | 22.56 |
| Inventories | .0 | 8.9 | 14.2 | 10.9 | 27.5 | 22.6 | 31.9 | 45.1 | 63.7 | 89.9 |
| Inventories, % | 0 | 10.14 | 24.01 | 8.73 | 22.47 | 13.07 | 13.07 | 13.07 | 13.07 | 13.07 |
| Accounts Payable | 1.0 | 5.4 | 6.0 | 3.3 | 12.1 | 11.2 | 15.8 | 22.3 | 31.4 | 44.4 |
| Accounts Payable, % | 3.42 | 6.18 | 10.19 | 2.61 | 9.87 | 6.45 | 6.45 | 6.45 | 6.45 | 6.45 |
| Capital Expenditure | -14.0 | -21.1 | -5.7 | -6.2 | -148.7 | -64.1 | -90.6 | -127.9 | -180.7 | -255.2 |
| Capital Expenditure, % | -46.94 | -23.95 | -9.68 | -4.95 | -121.55 | -37.1 | -37.1 | -37.1 | -37.1 | -37.1 |
| Tax Rate, % | 5.48 | 5.48 | 5.48 | 5.48 | 5.48 | 5.48 | 5.48 | 5.48 | 5.48 | 5.48 |
| EBITAT | 119.5 | 156.0 | -118.7 | 69.0 | -30.0 | 42.8 | 60.4 | 85.3 | 120.5 | 170.3 |
| Depreciation | ||||||||||
| Changes in Account Receivables | ||||||||||
| Changes in Inventories | ||||||||||
| Changes in Accounts Payable | ||||||||||
| Capital Expenditure | ||||||||||
| UFCF | 110.8 | 132.0 | -114.4 | 6.0 | -98.2 | 2.1 | -6.4 | -9.0 | -12.7 | -18.0 |
| WACC, % | 5.86 | 5.67 | 5.84 | 5.85 | 5.79 | 5.8 | 5.8 | 5.8 | 5.8 | 5.8 |
| PV UFCF | ||||||||||
| SUM PV UFCF | -35.0 | |||||||||
| Long Term Growth Rate, % | 2.00 | |||||||||
| Free cash flow (T + 1) | -18 | |||||||||
| Terminal Value | -483 | |||||||||
| Present Terminal Value | -364 | |||||||||
| Enterprise Value | -399 | |||||||||
| Net Debt | -150 | |||||||||
| Equity Value | -250 | |||||||||
| Diluted Shares Outstanding, MM | 99 | |||||||||
| Equity Value Per Share | -2.52 |
What You Will Receive
- Comprehensive ACTG Financial Data: Pre-loaded with Acacia Research Corporation’s historical and projected figures for thorough analysis.
- Customizable Template: Easily adjust key metrics such as revenue growth, WACC, and EBITDA percentage.
- Instant Calculations: Watch the intrinsic value of Acacia Research Corporation update in real-time as you make changes.
- Advanced Valuation Tool: Tailored for investors, analysts, and consultants looking for precise DCF results.
- Intuitive Design: Clear layout and straightforward instructions suitable for all skill levels.
Key Features
- Comprehensive DCF Calculator: Features detailed unlevered and levered DCF valuation models tailored for Acacia Research Corporation (ACTG).
- WACC Estimator: Pre-configured Weighted Average Cost of Capital template with adjustable inputs for precise calculations.
- Customizable Forecast Inputs: Easily alter growth projections, capital expenditures, and discount rates as needed.
- Integrated Financial Ratios: Evaluate profitability, leverage, and efficiency ratios specifically for Acacia Research Corporation (ACTG).
- Visual Dashboard and Charts: Graphical representations provide a clear overview of essential valuation metrics for straightforward analysis.
How It Works
- Step 1: Download the prebuilt Excel template featuring Acacia Research Corporation’s (ACTG) data.
- Step 2: Navigate through the pre-filled sheets to familiarize yourself with the essential metrics.
- Step 3: Modify forecasts and assumptions in the editable yellow cells (WACC, growth, margins).
- Step 4: Instantly see the updated results, including Acacia Research Corporation’s intrinsic value.
- Step 5: Make well-informed investment decisions or create reports based on the outputs.
Why Choose This Calculator for Acacia Research Corporation (ACTG)?
- User-Friendly Interface: Perfect for both novice and seasoned users.
- Customizable Inputs: Adjust parameters to suit your specific analysis needs.
- Real-Time Feedback: Witness immediate updates to Acacia’s valuation as you tweak inputs.
- Preloaded Data: Comes with Acacia’s actual financial figures for swift evaluations.
- Relied Upon by Experts: Employed by investors and analysts for sound decision-making.
Who Should Use This Product?
- Investors: Accurately assess Acacia Research Corporation’s (ACTG) fair value prior to making investment choices.
- CFOs: Utilize a high-quality DCF model for financial reporting and analysis related to Acacia Research Corporation.
- Consultants: Efficiently customize the template for client valuation reports involving Acacia Research Corporation (ACTG).
- Entrepreneurs: Acquire knowledge about financial modeling practices employed by leading firms like Acacia Research Corporation.
- Educators: Implement it as a teaching resource to illustrate valuation techniques applicable to Acacia Research Corporation (ACTG).
What the Template Contains
- Pre-Filled Data: Includes Acacia Research Corporation’s historical financials and forecasts.
- Discounted Cash Flow Model: Editable DCF valuation model with automatic calculations.
- Weighted Average Cost of Capital (WACC): A dedicated sheet for calculating WACC based on custom inputs.
- Key Financial Ratios: Analyze Acacia Research Corporation’s profitability, efficiency, and leverage.
- Customizable Inputs: Edit revenue growth, margins, and tax rates with ease.
- Clear Dashboard: Charts and tables summarizing key valuation results.
Disclaimer
All information, articles, and product details provided on this website are for general informational and educational purposes only. We do not claim any ownership over, nor do we intend to infringe upon, any trademarks, copyrights, logos, brand names, or other intellectual property mentioned or depicted on this site. Such intellectual property remains the property of its respective owners, and any references here are made solely for identification or informational purposes, without implying any affiliation, endorsement, or partnership.
We make no representations or warranties, express or implied, regarding the accuracy, completeness, or suitability of any content or products presented. Nothing on this website should be construed as legal, tax, investment, financial, medical, or other professional advice. In addition, no part of this site—including articles or product references—constitutes a solicitation, recommendation, endorsement, advertisement, or offer to buy or sell any securities, franchises, or other financial instruments, particularly in jurisdictions where such activity would be unlawful.
All content is of a general nature and may not address the specific circumstances of any individual or entity. It is not a substitute for professional advice or services. Any actions you take based on the information provided here are strictly at your own risk. You accept full responsibility for any decisions or outcomes arising from your use of this website and agree to release us from any liability in connection with your use of, or reliance upon, the content or products found herein.