
|
Avaliação DCF do Grupo Almirante Plc (ADM.L) |
Totalmente Editável: Adapte-Se Às Suas Necessidades No Excel Ou Planilhas
Design Profissional: Modelos Confiáveis E Padrão Da Indústria
Pré-Construídos Para Uso Rápido E Eficiente
Compatível com MAC/PC, totalmente desbloqueado
Não É Necessária Experiência; Fácil De Seguir
Admiral Group plc (ADM.L) Bundle
Aprimore suas opções de investimento com a calculadora DCF do Admiral Group PLC (ADML)! Revise as finanças do grupo almirante autênticas, ajustam as projeções e despesas de crescimento e observe instantaneamente como essas modificações influenciam o valor intrínseco do Admiral Group Plc (ADML).
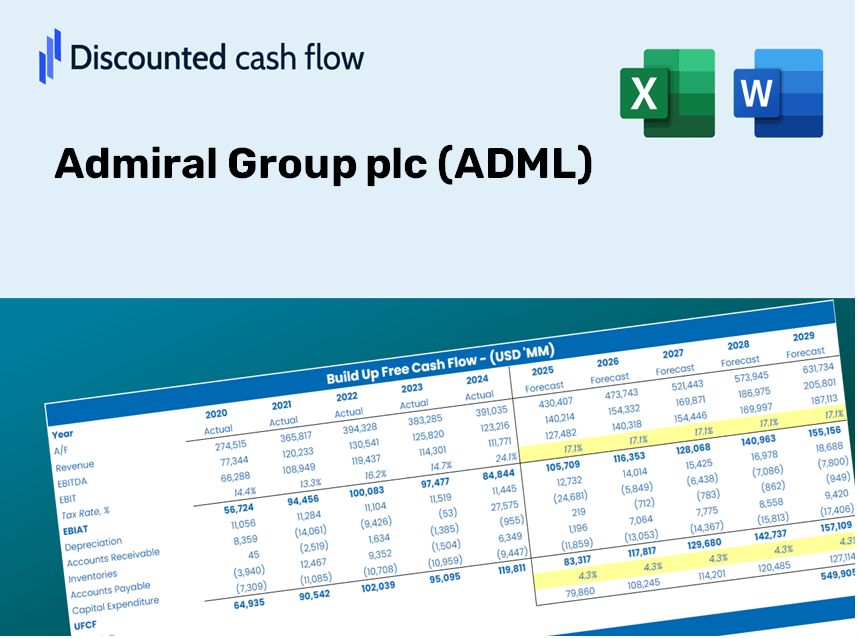
Discounted Cash Flow (DCF) - (USD MM)
| Year | AY1 2020 |
AY2 2021 |
AY3 2022 |
AY4 2023 |
AY5 2024 |
FY1 2025 |
FY2 2026 |
FY3 2027 |
FY4 2028 |
FY5 2029 |
|---|---|---|---|---|---|---|---|---|---|---|
| Revenue | 1,299.6 | 1,557.7 | 1,523.5 | 3,551.3 | 5,272.9 | 7,463.0 | 10,562.8 | 14,950.2 | 21,159.8 | 29,948.7 |
| Revenue Growth, % | 0 | 19.86 | -2.2 | 133.1 | 48.48 | 41.54 | 41.54 | 41.54 | 41.54 | 41.54 |
| EBITDA | 830.0 | 776.2 | 403.1 | 501.5 | 924.7 | 2,564.5 | 3,629.7 | 5,137.3 | 7,271.1 | 10,291.2 |
| EBITDA, % | 63.87 | 49.83 | 26.46 | 14.12 | 17.54 | 34.36 | 34.36 | 34.36 | 34.36 | 34.36 |
| Depreciation | 207.5 | 42.9 | 41.9 | 58.5 | 85.5 | 369.3 | 522.6 | 739.7 | 1,047.0 | 1,481.8 |
| Depreciation, % | 15.97 | 2.75 | 2.75 | 1.65 | 1.62 | 4.95 | 4.95 | 4.95 | 4.95 | 4.95 |
| EBIT | 622.5 | 733.3 | 361.2 | 443.0 | 839.2 | 2,195.2 | 3,107.0 | 4,397.5 | 6,224.1 | 8,809.3 |
| EBIT, % | 47.9 | 47.08 | 23.71 | 12.47 | 15.92 | 29.41 | 29.41 | 29.41 | 29.41 | 29.41 |
| Total Cash | 272.5 | 372.7 | 297.0 | 3,140.1 | 3,603.8 | 3,301.0 | 4,672.1 | 6,612.6 | 9,359.2 | 13,246.7 |
| Total Cash, percent | .0 | .0 | .0 | .0 | .0 | .0 | .0 | .0 | .0 | .0 |
| Account Receivables | 1,182.0 | 1,600.0 | .0 | .0 | 225.2 | 2,913.9 | 4,124.2 | 5,837.2 | 8,261.7 | 11,693.3 |
| Account Receivables, % | 90.95 | 102.72 | 0 | 0 | 4.27 | 39.04 | 39.04 | 39.04 | 39.04 | 39.04 |
| Inventories | .0 | .0 | .0 | .0 | .0 | .0 | .0 | .0 | .0 | .0 |
| Inventories, % | 0 | 0 | 0 | 0 | 0 | 0 | 0 | 0 | 0 | 0 |
| Accounts Payable | 1,636.9 | 1,600.0 | 138.5 | 199.2 | 52.4 | 3,219.5 | 4,556.7 | 6,449.3 | 9,128.1 | 12,919.5 |
| Accounts Payable, % | 125.95 | 102.72 | 9.09 | 5.61 | 0.99376 | 43.14 | 43.14 | 43.14 | 43.14 | 43.14 |
| Capital Expenditure | -43.1 | -69.2 | -98.6 | -75.9 | -144.2 | -285.1 | -403.6 | -571.2 | -808.4 | -1,144.2 |
| Capital Expenditure, % | -3.32 | -4.44 | -6.47 | -2.14 | -2.73 | -3.82 | -3.82 | -3.82 | -3.82 | -3.82 |
| Tax Rate, % | 20.96 | 20.96 | 20.96 | 20.96 | 20.96 | 20.96 | 20.96 | 20.96 | 20.96 | 20.96 |
| EBITAT | 541.2 | 610.0 | 286.5 | 338.2 | 663.3 | 1,777.3 | 2,515.6 | 3,560.4 | 5,039.2 | 7,132.3 |
| Depreciation | ||||||||||
| Changes in Account Receivables | ||||||||||
| Changes in Inventories | ||||||||||
| Changes in Accounts Payable | ||||||||||
| Capital Expenditure | ||||||||||
| UFCF | 1,160.5 | 128.8 | 368.3 | 381.5 | 232.6 | 2,339.8 | 2,761.6 | 3,908.6 | 5,532.0 | 7,829.8 |
| WACC, % | 4.85 | 4.83 | 4.81 | 4.8 | 4.81 | 4.82 | 4.82 | 4.82 | 4.82 | 4.82 |
| PV UFCF | ||||||||||
| SUM PV UFCF | 18,910.6 | |||||||||
| Long Term Growth Rate, % | 2.00 | |||||||||
| Free cash flow (T + 1) | 7,986 | |||||||||
| Terminal Value | 283,346 | |||||||||
| Present Terminal Value | 223,936 | |||||||||
| Enterprise Value | 242,847 | |||||||||
| Net Debt | 1,125 | |||||||||
| Equity Value | 241,722 | |||||||||
| Diluted Shares Outstanding, MM | 306 | |||||||||
| Equity Value Per Share | 78,915.42 |
Benefits You Will Receive
- Accurate ADML Financial Data: Pre-filled with Admiral Group plc’s historical and projected figures for thorough analysis.
- Completely Customizable Template: Effortlessly adjust key inputs such as revenue growth, WACC, and EBITDA %.
- Instant Calculations: Watch the intrinsic value of Admiral Group plc update in real-time as you make adjustments.
- Expert Valuation Tool: Crafted for investors, analysts, and consultants who require precise DCF outcomes.
- Intuitive Design: Straightforward layout and clear guidance suitable for all skill levels.
Key Features
- Customizable Forecast Inputs: Adjust essential parameters such as revenue growth, EBITDA percentage, and capital investments.
- Instant DCF Valuation: Automatically computes intrinsic value, NPV, and other financial metrics in real time.
- High-Precision Accuracy: Leverages Admiral Group plc’s (ADML) actual financial data for credible valuation results.
- Simplified Scenario Analysis: Easily evaluate various assumptions and analyze the resulting impacts.
- Efficiency Booster: Avoid the hassle of constructing intricate valuation models from the ground up.
How It Works
- Download: Obtain the pre-formatted Excel file featuring Admiral Group plc's (ADML) financial information.
- Customize: Tailor forecasts, including revenue growth, EBITDA %, and WACC to fit your analysis.
- Update Automatically: Real-time updates for intrinsic value and NPV calculations as you make changes.
- Test Scenarios: Generate various projections and instantly compare the results.
- Make Decisions: Utilize the valuation findings to inform your investment approach.
Why Select the Admiral Group plc (ADML) Calculator?
- Time-Efficient: Skip the hassle of building a DCF model from the ground up – it's ready for immediate use.
- Enhanced Accuracy: Dependable financial data and formulas help minimize valuation errors.
- Completely Customizable: Adjust the model to align with your specific assumptions and forecasts.
- User-Friendly: Intuitive charts and outputs simplify result analysis.
- Endorsed by Professionals: Crafted for those who prioritize precision and functionality.
Who Should Utilize This Product?
- Finance Students: Master valuation techniques and apply them to real-world data.
- Academics: Integrate industry models into your teaching or research projects.
- Investors: Validate your investment hypotheses and assess valuation outcomes for Admiral Group plc (ADML) stock.
- Analysts: Enhance your efficiency with a tailored, pre-existing DCF model.
- Small Business Owners: Understand the analytical approaches used for evaluating large public companies like Admiral Group plc (ADML).
Contents of the Template
- Pre-Filled Data: Contains Admiral Group plc's historical financial figures and projections.
- Discounted Cash Flow Model: An editable DCF valuation model featuring automatic calculations.
- Weighted Average Cost of Capital (WACC): A specific sheet designed for calculating WACC using customized inputs.
- Key Financial Ratios: Assess Admiral Group plc's profitability, efficiency, and financial leverage.
- Customizable Inputs: Easily modify revenue growth rates, profit margins, and tax rates.
- Clear Dashboard: Visual charts and tables that summarize essential valuation outcomes.
Disclaimer
All information, articles, and product details provided on this website are for general informational and educational purposes only. We do not claim any ownership over, nor do we intend to infringe upon, any trademarks, copyrights, logos, brand names, or other intellectual property mentioned or depicted on this site. Such intellectual property remains the property of its respective owners, and any references here are made solely for identification or informational purposes, without implying any affiliation, endorsement, or partnership.
We make no representations or warranties, express or implied, regarding the accuracy, completeness, or suitability of any content or products presented. Nothing on this website should be construed as legal, tax, investment, financial, medical, or other professional advice. In addition, no part of this site—including articles or product references—constitutes a solicitation, recommendation, endorsement, advertisement, or offer to buy or sell any securities, franchises, or other financial instruments, particularly in jurisdictions where such activity would be unlawful.
All content is of a general nature and may not address the specific circumstances of any individual or entity. It is not a substitute for professional advice or services. Any actions you take based on the information provided here are strictly at your own risk. You accept full responsibility for any decisions or outcomes arising from your use of this website and agree to release us from any liability in connection with your use of, or reliance upon, the content or products found herein.