
|
Adyen N.V. (Adyen.as) Avaliação DCF |
Totalmente Editável: Adapte-Se Às Suas Necessidades No Excel Ou Planilhas
Design Profissional: Modelos Confiáveis E Padrão Da Indústria
Pré-Construídos Para Uso Rápido E Eficiente
Compatível com MAC/PC, totalmente desbloqueado
Não É Necessária Experiência; Fácil De Seguir
Adyen N.V. (ADYEN.AS) Bundle
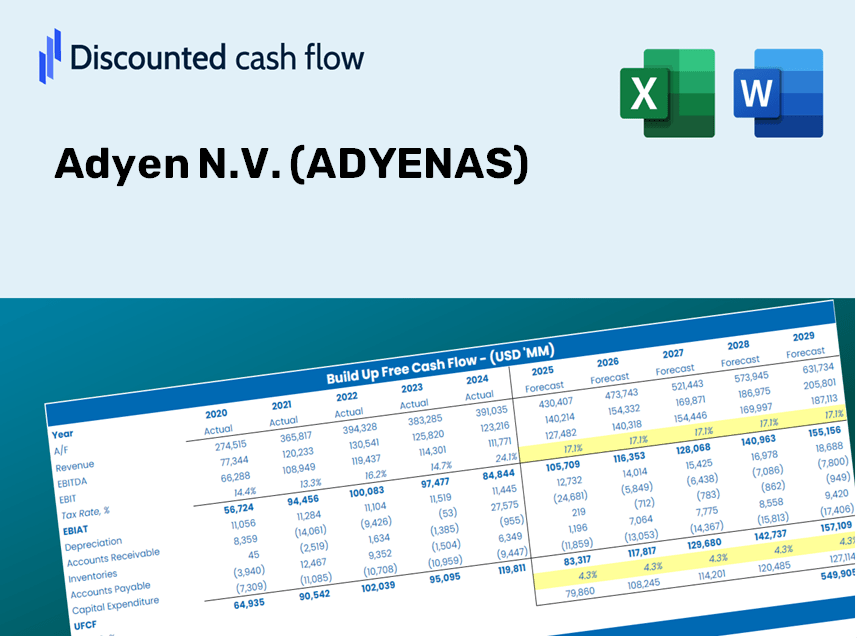
Otimize seu tempo e melhore a precisão com a nossa calculadora DCF (Adyenas)! Utilizando dados reais de Adyen N.V. e suposições personalizáveis, essa ferramenta o capacita a prever, analisar e valorizar Adyen como um investidor experiente.
Discounted Cash Flow (DCF) - (USD MM)
| Year | AY1 2020 |
AY2 2021 |
AY3 2022 |
AY4 2023 |
AY5 2024 |
FY1 2025 |
FY2 2026 |
FY3 2027 |
FY4 2028 |
FY5 2029 |
|---|---|---|---|---|---|---|---|---|---|---|
| Revenue | 3,641.4 | 5,995.4 | 8,935.6 | 1,863.4 | 2,252.7 | 2,564.9 | 2,920.3 | 3,325.0 | 3,785.8 | 4,310.5 |
| Revenue Growth, % | 0 | 64.65 | 49.04 | -79.15 | 20.89 | 13.86 | 13.86 | 13.86 | 13.86 | 13.86 |
| EBITDA | 361.2 | 628.6 | 795.5 | 1,032.8 | 1,357.9 | 743.9 | 847.0 | 964.4 | 1,098.0 | 1,250.2 |
| EBITDA, % | 9.92 | 10.49 | 8.9 | 55.43 | 60.28 | 29 | 29 | 29 | 29 | 29 |
| Depreciation | 28.6 | 35.0 | 63.6 | 85.5 | 104.5 | 58.0 | 66.0 | 75.2 | 85.6 | 97.4 |
| Depreciation, % | 0.78451 | 0.58396 | 0.7119 | 4.59 | 4.64 | 2.26 | 2.26 | 2.26 | 2.26 | 2.26 |
| EBIT | 332.6 | 593.6 | 731.9 | 947.4 | 1,253.5 | 685.9 | 781.0 | 889.2 | 1,012.4 | 1,152.7 |
| EBIT, % | 9.13 | 9.9 | 8.19 | 50.84 | 55.64 | 26.74 | 26.74 | 26.74 | 26.74 | 26.74 |
| Total Cash | 2,745.2 | 4,596.4 | 6,453.8 | 8,218.1 | 9,988.9 | 2,176.5 | 2,478.1 | 2,821.5 | 3,212.5 | 3,657.7 |
| Total Cash, percent | .0 | .0 | .0 | .0 | .0 | .0 | .0 | .0 | .0 | .0 |
| Account Receivables | 75.1 | 56.9 | 89.4 | 134.3 | 805.3 | 240.9 | 274.3 | 312.3 | 355.6 | 404.9 |
| Account Receivables, % | 2.06 | 0.94826 | 0.99993 | 7.21 | 35.75 | 9.39 | 9.39 | 9.39 | 9.39 | 9.39 |
| Inventories | 19.5 | 22.1 | 87.9 | 104.5 | .0 | 38.5 | 43.8 | 49.9 | 56.8 | 64.6 |
| Inventories, % | 0.53683 | 0.36925 | 0.9836 | 5.61 | 0 | 1.5 | 1.5 | 1.5 | 1.5 | 1.5 |
| Accounts Payable | 8.3 | 9.0 | 19.9 | 14.1 | 254.1 | 64.8 | 73.8 | 84.1 | 95.7 | 109.0 |
| Accounts Payable, % | 0.22815 | 0.14993 | 0.22295 | 0.75722 | 11.28 | 2.53 | 2.53 | 2.53 | 2.53 | 2.53 |
| Capital Expenditure | -17.1 | -51.4 | -95.6 | -69.7 | -101.2 | -54.5 | -62.1 | -70.7 | -80.5 | -91.7 |
| Capital Expenditure, % | -0.46952 | -0.8571 | -1.07 | -3.74 | -4.49 | -2.13 | -2.13 | -2.13 | -2.13 | -2.13 |
| Tax Rate, % | 24.58 | 24.58 | 24.58 | 24.58 | 24.58 | 24.58 | 24.58 | 24.58 | 24.58 | 24.58 |
| EBITAT | 268.6 | 480.1 | 573.5 | 701.9 | 945.3 | 534.3 | 608.4 | 692.7 | 788.7 | 897.9 |
| Depreciation | ||||||||||
| Changes in Account Receivables | ||||||||||
| Changes in Inventories | ||||||||||
| Changes in Accounts Payable | ||||||||||
| Capital Expenditure | ||||||||||
| UFCF | 193.8 | 480.0 | 454.2 | 650.2 | 622.0 | 874.4 | 582.5 | 663.3 | 755.2 | 859.8 |
| WACC, % | 13.88 | 13.88 | 13.88 | 13.88 | 13.88 | 13.88 | 13.88 | 13.88 | 13.88 | 13.88 |
| PV UFCF | ||||||||||
| SUM PV UFCF | 2,564.0 | |||||||||
| Long Term Growth Rate, % | 2.00 | |||||||||
| Free cash flow (T + 1) | 877 | |||||||||
| Terminal Value | 7,382 | |||||||||
| Present Terminal Value | 3,854 | |||||||||
| Enterprise Value | 6,418 | |||||||||
| Net Debt | -9,737 | |||||||||
| Equity Value | 16,154 | |||||||||
| Diluted Shares Outstanding, MM | 31 | |||||||||
| Equity Value Per Share | 516.71 |
What You Will Receive
- Authentic ADYEN Financial Data: Pre-filled with Adyen N.V.’s historical and projected metrics for accurate analysis.
- Completely Customizable Template: Easily adjust key inputs such as revenue growth, WACC, and EBITDA %.
- Instant Calculations: Witness the automatic update of Adyen’s intrinsic value as you modify inputs.
- Expert Valuation Tool: Tailored for investors, analysts, and consultants in need of precise DCF results.
- Intuitive Design: Streamlined layout and straightforward instructions suitable for all skill levels.
Key Features
- Customizable Financial Inputs: Adjust essential variables such as transaction volume growth, payment processing fees, and operational costs.
- Instant DCF Valuation: Quickly computes intrinsic value, net present value (NPV), and other key financial metrics.
- Highly Accurate Projections: Leverages real-world data from Adyen N.V. (ADYENAS) for precise and reliable valuation results.
- Effortless Scenario Analysis: Easily evaluate various assumptions and visualize their impact on outcomes.
- Efficiency Booster: Avoid the hassle of developing intricate valuation models from the ground up.
How It Functions
- Step 1: Download the Excel spreadsheet.
- Step 2: Examine Adyen N.V.'s pre-filled financial data and projections.
- Step 3: Adjust key inputs such as revenue growth, WACC, and tax rates (highlighted cells).
- Step 4: Observe the DCF model update in real-time as you modify your assumptions.
- Step 5: Review the outcomes and leverage the results for informed investment choices.
Why Opt for This Calculator?
- User-Friendly Interface: Perfect for both novice and seasoned users.
- Customizable Inputs: Adjust parameters easily to suit your analysis needs.
- Real-Time Adjustments: Witness immediate changes in Adyen's valuation as you modify inputs.
- Instant Access: Comes pre-loaded with Adyen’s actual financial data for rapid assessments.
- Widely Accepted: Favored by investors and analysts alike for informed decision-making.
Who Can Benefit from This Product?
- Investors: Assess Adyen's valuation before making stock transactions.
- CFOs and Financial Analysts: Optimize valuation workflows and evaluate financial forecasts.
- Startup Founders: Discover how leading public companies like Adyen are valued.
- Consultants: Provide clients with detailed and professional valuation reports.
- Students and Educators: Apply real-world data to learn and teach valuation methodologies.
Contents of the Template
- Pre-Filled Data: Contains Adyen N.V.'s historical financials and projections.
- Discounted Cash Flow Model: An editable DCF valuation model featuring automatic calculations.
- Weighted Average Cost of Capital (WACC): A dedicated worksheet for calculating WACC using tailored inputs.
- Key Financial Ratios: Evaluate Adyen N.V.'s profitability, efficiency, and financial leverage.
- Customizable Inputs: Easily modify revenue growth, margins, and tax rates.
- Clear Dashboard: Visualizations and tables highlighting essential valuation outcomes.
Disclaimer
All information, articles, and product details provided on this website are for general informational and educational purposes only. We do not claim any ownership over, nor do we intend to infringe upon, any trademarks, copyrights, logos, brand names, or other intellectual property mentioned or depicted on this site. Such intellectual property remains the property of its respective owners, and any references here are made solely for identification or informational purposes, without implying any affiliation, endorsement, or partnership.
We make no representations or warranties, express or implied, regarding the accuracy, completeness, or suitability of any content or products presented. Nothing on this website should be construed as legal, tax, investment, financial, medical, or other professional advice. In addition, no part of this site—including articles or product references—constitutes a solicitation, recommendation, endorsement, advertisement, or offer to buy or sell any securities, franchises, or other financial instruments, particularly in jurisdictions where such activity would be unlawful.
All content is of a general nature and may not address the specific circumstances of any individual or entity. It is not a substitute for professional advice or services. Any actions you take based on the information provided here are strictly at your own risk. You accept full responsibility for any decisions or outcomes arising from your use of this website and agree to release us from any liability in connection with your use of, or reliance upon, the content or products found herein.