
|
American Financial Group, Inc. (AFG) Avaliação DCF |
Totalmente Editável: Adapte-Se Às Suas Necessidades No Excel Ou Planilhas
Design Profissional: Modelos Confiáveis E Padrão Da Indústria
Pré-Construídos Para Uso Rápido E Eficiente
Compatível com MAC/PC, totalmente desbloqueado
Não É Necessária Experiência; Fácil De Seguir
American Financial Group, Inc. (AFG) Bundle
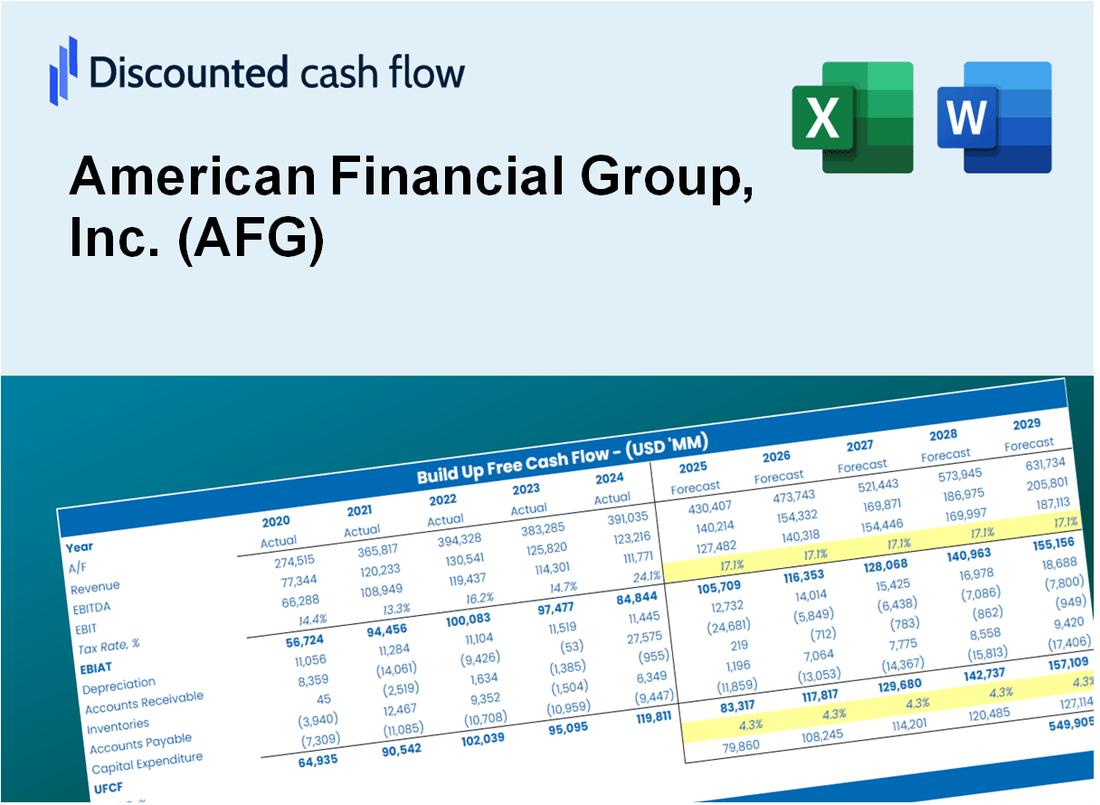
Projetado para precisão, nossa calculadora DCF (AFG) permite avaliar a avaliação do American Financial Group, Inc. usando dados financeiros do mundo real e fornece flexibilidade completa para modificar todos os parâmetros essenciais para melhorar as projeções.
Discounted Cash Flow (DCF) - (USD MM)
| Year | AY1 2020 |
AY2 2021 |
AY3 2022 |
AY4 2023 |
AY5 2024 |
FY1 2025 |
FY2 2026 |
FY3 2027 |
FY4 2028 |
FY5 2029 |
|---|---|---|---|---|---|---|---|---|---|---|
| Revenue | 5,670.0 | 6,231.0 | 6,773.0 | 7,728.0 | 8,278.0 | 9,101.9 | 10,007.7 | 11,003.7 | 12,098.9 | 13,303.0 |
| Revenue Growth, % | 0 | 9.89 | 8.7 | 14.1 | 7.12 | 9.95 | 9.95 | 9.95 | 9.95 | 9.95 |
| EBITDA | 726.0 | 1,616.0 | 1,308.0 | 1,227.0 | 1,281.0 | 1,627.5 | 1,789.4 | 1,967.5 | 2,163.4 | 2,378.7 |
| EBITDA, % | 12.8 | 25.93 | 19.31 | 15.88 | 15.47 | 17.88 | 17.88 | 17.88 | 17.88 | 17.88 |
| Depreciation | 299.0 | 187.0 | 100.0 | 78.0 | 81.0 | 213.7 | 235.0 | 258.3 | 284.1 | 312.3 |
| Depreciation, % | 5.27 | 3 | 1.48 | 1.01 | 0.9785 | 2.35 | 2.35 | 2.35 | 2.35 | 2.35 |
| EBIT | 427.0 | 1,429.0 | 1,208.0 | 1,149.0 | 1,200.0 | 1,413.8 | 1,554.5 | 1,709.2 | 1,879.3 | 2,066.3 |
| EBIT, % | 7.53 | 22.93 | 17.84 | 14.87 | 14.5 | 15.53 | 15.53 | 15.53 | 15.53 | 15.53 |
| Total Cash | 10,749.0 | 12,488.0 | 10,967.0 | 1,746.0 | 1,946.0 | 6,300.3 | 6,927.4 | 7,616.8 | 8,374.9 | 9,208.4 |
| Total Cash, percent | .0 | .0 | .0 | .0 | .0 | .0 | .0 | .0 | .0 | .0 |
| Account Receivables | 5,195.0 | 5,641.0 | 6,202.0 | 7,119.0 | 7,831.0 | 8,381.8 | 9,216.0 | 10,133.2 | 11,141.7 | 12,250.5 |
| Account Receivables, % | 91.62 | 90.53 | 91.57 | 92.12 | 94.6 | 92.09 | 92.09 | 92.09 | 92.09 | 92.09 |
| Inventories | .0 | -5,493.0 | .0 | -8,865.0 | .0 | -3,425.1 | -3,766.0 | -4,140.8 | -4,552.9 | -5,006.1 |
| Inventories, % | 0 | -88.16 | 0 | -114.71 | 0 | -37.63 | -37.63 | -37.63 | -37.63 | -37.63 |
| Accounts Payable | 3,924.0 | 4,339.0 | 1,035.0 | 1,186.0 | 1,191.0 | 3,346.9 | 3,680.0 | 4,046.2 | 4,448.9 | 4,891.7 |
| Accounts Payable, % | 69.21 | 69.64 | 15.28 | 15.35 | 14.39 | 36.77 | 36.77 | 36.77 | 36.77 | 36.77 |
| Capital Expenditure | -343.0 | -150.0 | -86.0 | -72.0 | .0 | -194.0 | -213.3 | -234.6 | -257.9 | -283.6 |
| Capital Expenditure, % | -6.05 | -2.41 | -1.27 | -0.93168 | 0 | -2.13 | -2.13 | -2.13 | -2.13 | -2.13 |
| Tax Rate, % | 21.09 | 21.09 | 21.09 | 21.09 | 21.09 | 21.09 | 21.09 | 21.09 | 21.09 | 21.09 |
| EBITAT | 922.0 | 2,135.5 | 966.0 | 912.3 | 947.0 | 1,239.3 | 1,362.6 | 1,498.2 | 1,647.3 | 1,811.3 |
| Depreciation | ||||||||||
| Changes in Account Receivables | ||||||||||
| Changes in Inventories | ||||||||||
| Changes in Accounts Payable | ||||||||||
| Capital Expenditure | ||||||||||
| UFCF | -393.0 | 7,634.5 | -8,378.0 | 9,017.3 | -8,544.0 | 6,289.2 | 1,224.0 | 1,345.8 | 1,479.8 | 1,627.1 |
| WACC, % | 6.75 | 6.75 | 6.64 | 6.64 | 6.63 | 6.68 | 6.68 | 6.68 | 6.68 | 6.68 |
| PV UFCF | ||||||||||
| SUM PV UFCF | 10,399.1 | |||||||||
| Long Term Growth Rate, % | 2.00 | |||||||||
| Free cash flow (T + 1) | 1,660 | |||||||||
| Terminal Value | 35,444 | |||||||||
| Present Terminal Value | 25,650 | |||||||||
| Enterprise Value | 36,049 | |||||||||
| Net Debt | 69 | |||||||||
| Equity Value | 35,980 | |||||||||
| Diluted Shares Outstanding, MM | 84 | |||||||||
| Equity Value Per Share | 428.84 |
What You Will Get
- Real AFG Financials: Access to historical and projected data for precise valuation.
- Customizable Inputs: Adjust WACC, tax rates, revenue growth, and capital expenditures as needed.
- Dynamic Calculations: Intrinsic value and NPV are computed in real-time.
- Scenario Analysis: Evaluate various scenarios to assess American Financial Group’s future performance.
- User-Friendly Design: Designed for professionals while remaining approachable for newcomers.
Key Features
- Customizable Financial Metrics: Adjust essential inputs such as premium growth, underwriting profit margin, and investment income.
- Instant DCF Valuation: Quickly computes intrinsic value, NPV, and other financial metrics.
- High-Precision Accuracy: Leverages AFG's actual financial data for credible valuation results.
- Streamlined Scenario Analysis: Effortlessly evaluate various assumptions and assess different outcomes.
- Efficiency Booster: Avoid the hassle of constructing intricate valuation models from the ground up.
How It Works
- Download the Template: Gain immediate access to the Excel-based AFG DCF Calculator.
- Input Your Assumptions: Modify the yellow-highlighted cells for growth rates, WACC, margins, and other variables.
- Instant Calculations: The model automatically recalculates American Financial Group’s intrinsic value.
- Test Scenarios: Experiment with various assumptions to assess potential changes in valuation.
- Analyze and Decide: Utilize the results to inform your investment or financial strategy.
Why Choose This Calculator for American Financial Group, Inc. (AFG)?
- Designed for Industry Experts: A sophisticated tool tailored for analysts, CFOs, and financial consultants.
- Accurate Financial Data: Historical and projected financials for AFG are preloaded to ensure precision.
- Flexible Scenario Analysis: Effortlessly simulate various forecasts and assumptions.
- Comprehensive Outputs: Automatically computes intrinsic value, NPV, and essential financial metrics.
- User-Friendly Interface: Step-by-step guidance makes the process straightforward.
Who Should Use This Product?
- Institutional Investors: Develop comprehensive and accurate valuation models for analyzing AFG's portfolio.
- Corporate Finance Departments: Evaluate valuation scenarios to inform strategic decisions within the organization.
- Financial Consultants and Advisors: Deliver precise valuation insights for American Financial Group, Inc. (AFG) to clients.
- Students and Instructors: Utilize real-time data to enhance learning and practice in financial modeling.
- Finance Enthusiasts: Gain insights into the market valuation of financial services companies like AFG.
What the Template Contains
- Historical Data: Includes American Financial Group, Inc.'s (AFG) past financials and baseline forecasts.
- DCF and Levered DCF Models: Detailed templates to calculate American Financial Group, Inc.'s (AFG) intrinsic value.
- WACC Sheet: Pre-built calculations for Weighted Average Cost of Capital.
- Editable Inputs: Modify key drivers like growth rates, EBITDA %, and CAPEX assumptions.
- Quarterly and Annual Statements: A complete breakdown of American Financial Group, Inc.'s (AFG) financials.
- Interactive Dashboard: Visualize valuation results and projections dynamically.
Disclaimer
All information, articles, and product details provided on this website are for general informational and educational purposes only. We do not claim any ownership over, nor do we intend to infringe upon, any trademarks, copyrights, logos, brand names, or other intellectual property mentioned or depicted on this site. Such intellectual property remains the property of its respective owners, and any references here are made solely for identification or informational purposes, without implying any affiliation, endorsement, or partnership.
We make no representations or warranties, express or implied, regarding the accuracy, completeness, or suitability of any content or products presented. Nothing on this website should be construed as legal, tax, investment, financial, medical, or other professional advice. In addition, no part of this site—including articles or product references—constitutes a solicitation, recommendation, endorsement, advertisement, or offer to buy or sell any securities, franchises, or other financial instruments, particularly in jurisdictions where such activity would be unlawful.
All content is of a general nature and may not address the specific circumstances of any individual or entity. It is not a substitute for professional advice or services. Any actions you take based on the information provided here are strictly at your own risk. You accept full responsibility for any decisions or outcomes arising from your use of this website and agree to release us from any liability in connection with your use of, or reliance upon, the content or products found herein.