
|
American Financial Group, Inc. (AFGB) Avaliação DCF |
Totalmente Editável: Adapte-Se Às Suas Necessidades No Excel Ou Planilhas
Design Profissional: Modelos Confiáveis E Padrão Da Indústria
Pré-Construídos Para Uso Rápido E Eficiente
Compatível com MAC/PC, totalmente desbloqueado
Não É Necessária Experiência; Fácil De Seguir
American Financial Group, Inc. (AFGB) Bundle
Projetado para precisão, a nossa calculadora DCF (AFGB) permite avaliar a avaliação do American Financial Group, Inc. usando dados financeiros do mundo real e oferece flexibilidade completa para modificar todos os parâmetros principais para projeções aprimoradas.
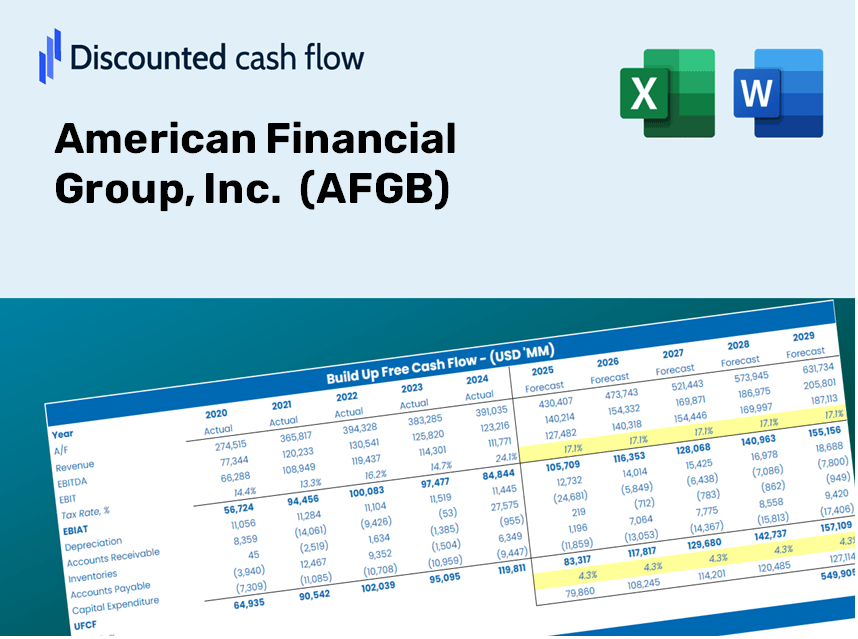
Discounted Cash Flow (DCF) - (USD MM)
| Year | AY1 2020 |
AY2 2021 |
AY3 2022 |
AY4 2023 |
AY5 2024 |
FY1 2025 |
FY2 2026 |
FY3 2027 |
FY4 2028 |
FY5 2029 |
|---|---|---|---|---|---|---|---|---|---|---|
| Revenue | 5,647.0 | 6,227.0 | 6,773.0 | 7,732.0 | 8,324.0 | 9,174.2 | 10,111.2 | 11,143.9 | 12,282.2 | 13,536.6 |
| Revenue Growth, % | 0 | 10.27 | 8.77 | 14.16 | 7.66 | 10.21 | 10.21 | 10.21 | 10.21 | 10.21 |
| EBITDA | 427.0 | 1,616.0 | 1,308.0 | 1,227.0 | 1,200.0 | 1,524.9 | 1,680.7 | 1,852.4 | 2,041.5 | 2,250.1 |
| EBITDA, % | 7.56 | 25.95 | 19.31 | 15.87 | 14.42 | 16.62 | 16.62 | 16.62 | 16.62 | 16.62 |
| Depreciation | .0 | 187.0 | 100.0 | 78.0 | .0 | 100.7 | 111.0 | 122.3 | 134.8 | 148.6 |
| Depreciation, % | 0 | 3 | 1.48 | 1.01 | 0 | 1.1 | 1.1 | 1.1 | 1.1 | 1.1 |
| EBIT | 427.0 | 1,429.0 | 1,208.0 | 1,149.0 | 1,200.0 | 1,424.2 | 1,569.7 | 1,730.0 | 1,906.7 | 2,101.5 |
| EBIT, % | 7.56 | 22.95 | 17.84 | 14.86 | 14.42 | 15.52 | 15.52 | 15.52 | 15.52 | 15.52 |
| Total Cash | 1,665.0 | 2,131.0 | 872.0 | 1,225.0 | 1,406.0 | 2,005.8 | 2,210.6 | 2,436.4 | 2,685.3 | 2,959.5 |
| Total Cash, percent | .0 | .0 | .0 | .0 | .0 | .0 | .0 | .0 | .0 | .0 |
| Account Receivables | .0 | .0 | .0 | .0 | 1,123.0 | 247.5 | 272.8 | 300.7 | 331.4 | 365.2 |
| Account Receivables, % | 0 | 0 | 0 | 0 | 13.49 | 2.7 | 2.7 | 2.7 | 2.7 | 2.7 |
| Inventories | .0 | -857.0 | -886.0 | -2,396.0 | .0 | -1,061.1 | -1,169.5 | -1,289.0 | -1,420.6 | -1,565.7 |
| Inventories, % | 0 | -13.76 | -13.08 | -30.99 | 0 | -11.57 | -11.57 | -11.57 | -11.57 | -11.57 |
| Accounts Payable | 807.0 | 920.0 | 1,035.0 | 1,186.0 | .0 | 1,095.1 | 1,207.0 | 1,330.3 | 1,466.1 | 1,615.9 |
| Accounts Payable, % | 14.29 | 14.77 | 15.28 | 15.34 | 0 | 11.94 | 11.94 | 11.94 | 11.94 | 11.94 |
| Capital Expenditure | -60.0 | -62.0 | -86.0 | -72.0 | -133.0 | -107.5 | -118.4 | -130.5 | -143.9 | -158.6 |
| Capital Expenditure, % | -1.06 | -0.99566 | -1.27 | -0.9312 | -1.6 | -1.17 | -1.17 | -1.17 | -1.17 | -1.17 |
| Tax Rate, % | 21.09 | 21.09 | 21.09 | 21.09 | 21.09 | 21.09 | 21.09 | 21.09 | 21.09 | 21.09 |
| EBITAT | 922.0 | 1,433.3 | 966.0 | 912.3 | 947.0 | 1,248.4 | 1,375.9 | 1,516.5 | 1,671.4 | 1,842.1 |
| Depreciation | ||||||||||
| Changes in Account Receivables | ||||||||||
| Changes in Inventories | ||||||||||
| Changes in Accounts Payable | ||||||||||
| Capital Expenditure | ||||||||||
| UFCF | 1,669.0 | 2,528.3 | 1,124.0 | 2,579.3 | -3,891.0 | 4,273.4 | 1,563.4 | 1,723.1 | 1,899.1 | 2,093.1 |
| WACC, % | 6.23 | 6.23 | 5.77 | 5.76 | 5.75 | 5.95 | 5.95 | 5.95 | 5.95 | 5.95 |
| PV UFCF | ||||||||||
| SUM PV UFCF | 9,950.4 | |||||||||
| Long Term Growth Rate, % | 2.00 | |||||||||
| Free cash flow (T + 1) | 2,135 | |||||||||
| Terminal Value | 54,081 | |||||||||
| Present Terminal Value | 40,512 | |||||||||
| Enterprise Value | 50,462 | |||||||||
| Net Debt | 69 | |||||||||
| Equity Value | 50,393 | |||||||||
| Diluted Shares Outstanding, MM | 84 | |||||||||
| Equity Value Per Share | 600.64 |
Benefits of Choosing American Financial Group, Inc. (AFGB)
- Comprehensive Financial Model: Utilize actual data from American Financial Group for accurate DCF valuation.
- Complete Forecast Customization: Modify revenue growth, profit margins, WACC, and other essential parameters.
- Real-Time Calculations: Automated updates provide immediate feedback as you adjust inputs.
- Professional-Grade Template: A polished Excel document crafted for high-level valuation purposes.
- Flexible and Reusable: Engineered for adaptability, enabling multiple uses for in-depth forecasts.
Key Features
- Customizable Financial Inputs: Adjust essential metrics such as revenue growth, EBITDA %, and capital outlays.
- Instant DCF Valuation: Automatically computes intrinsic value, NPV, and other financial metrics without delay.
- High-Precision Analysis: Leverages American Financial Group, Inc.'s (AFGB) real-world financial data for accurate valuation results.
- Streamlined Scenario Analysis: Effortlessly evaluate various assumptions and analyze outcomes side by side.
- Efficiency Boost: Avoid the hassle of creating intricate valuation models from the ground up.
How It Functions
- Step 1: Download the Excel file.
- Step 2: Examine the pre-populated American Financial Group, Inc. (AFGB) data (both historical and projected).
- Step 3: Modify key assumptions (highlighted in yellow) according to your findings.
- Step 4: Observe automatic recalculations reflecting the intrinsic value of American Financial Group, Inc. (AFGB).
- Step 5: Utilize the results for making informed investment choices or for reporting purposes.
Why Select the AFGB Calculator?
- Time-Saving: Skip the hassle of building a DCF model from the ground up – it’s ready for immediate use.
- Enhanced Accuracy: Dependable financial data and formulas minimize errors in your valuation process.
- Completely Customizable: Adjust the model to align with your unique assumptions and forecasts.
- Intuitive Design: User-friendly charts and outputs simplify result analysis.
- Endorsed by Professionals: Crafted for experts who prioritize precision and functionality.
Who Can Benefit from This Product?
- Investors: Effectively assess American Financial Group, Inc.'s (AFGB) fair value prior to making investment choices.
- CFOs: Utilize a top-tier DCF model for enhanced financial reporting and analysis.
- Consultants: Easily modify the template to create valuation reports tailored for clients.
- Entrepreneurs: Acquire insights into financial modeling practices employed by leading corporations.
- Educators: Implement it as a teaching resource to illustrate various valuation methodologies.
What the Template Contains
- Historical Data: Comprehensive analysis of American Financial Group, Inc.'s (AFGB) previous financial performance and foundational forecasts.
- DCF and Levered DCF Models: In-depth templates designed to calculate the intrinsic value of American Financial Group, Inc. (AFGB).
- WACC Sheet: Pre-configured calculations for the Weighted Average Cost of Capital.
- Editable Inputs: Customize essential factors such as growth rates, EBITDA %, and CAPEX estimates.
- Quarterly and Annual Statements: A thorough overview of American Financial Group, Inc.'s (AFGB) financials.
- Interactive Dashboard: Dynamically visualize valuation outcomes and future projections.
Disclaimer
All information, articles, and product details provided on this website are for general informational and educational purposes only. We do not claim any ownership over, nor do we intend to infringe upon, any trademarks, copyrights, logos, brand names, or other intellectual property mentioned or depicted on this site. Such intellectual property remains the property of its respective owners, and any references here are made solely for identification or informational purposes, without implying any affiliation, endorsement, or partnership.
We make no representations or warranties, express or implied, regarding the accuracy, completeness, or suitability of any content or products presented. Nothing on this website should be construed as legal, tax, investment, financial, medical, or other professional advice. In addition, no part of this site—including articles or product references—constitutes a solicitation, recommendation, endorsement, advertisement, or offer to buy or sell any securities, franchises, or other financial instruments, particularly in jurisdictions where such activity would be unlawful.
All content is of a general nature and may not address the specific circumstances of any individual or entity. It is not a substitute for professional advice or services. Any actions you take based on the information provided here are strictly at your own risk. You accept full responsibility for any decisions or outcomes arising from your use of this website and agree to release us from any liability in connection with your use of, or reliance upon, the content or products found herein.