
|
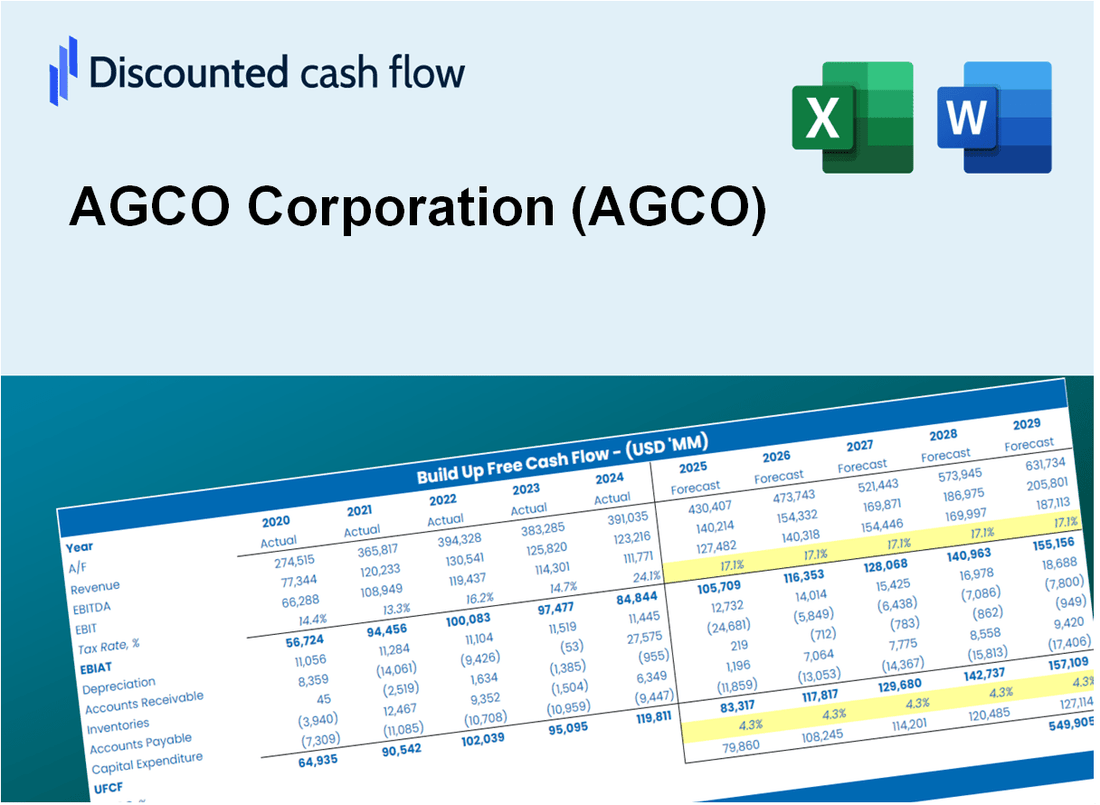
Avaliação DCF da Agco Corporation (AGCO) |
Totalmente Editável: Adapte-Se Às Suas Necessidades No Excel Ou Planilhas
Design Profissional: Modelos Confiáveis E Padrão Da Indústria
Pré-Construídos Para Uso Rápido E Eficiente
Compatível com MAC/PC, totalmente desbloqueado
Não É Necessária Experiência; Fácil De Seguir
AGCO Corporation (AGCO) Bundle
Seja você um investidor ou analista, esta calculadora DCF da Agco Corporation (AGCO) é sua ferramenta preferida para uma avaliação precisa. Carregado com dados reais da AGCO, você pode ajustar as previsões e observar instantaneamente os efeitos.
Discounted Cash Flow (DCF) - (USD MM)
| Year | AY1 2020 |
AY2 2021 |
AY3 2022 |
AY4 2023 |
AY5 2024 |
FY1 2025 |
FY2 2026 |
FY3 2027 |
FY4 2028 |
FY5 2029 |
|---|---|---|---|---|---|---|---|---|---|---|
| Revenue | 9,149.7 | 11,138.3 | 12,651.4 | 14,412.4 | 11,661.9 | 12,541.0 | 13,486.4 | 14,503.1 | 15,596.4 | 16,772.1 |
| Revenue Growth, % | 0 | 21.73 | 13.58 | 13.92 | -19.08 | 7.54 | 7.54 | 7.54 | 7.54 | 7.54 |
| EBITDA | 858.9 | 1,251.5 | 1,422.8 | 1,692.2 | 58.6 | 1,106.4 | 1,189.9 | 1,279.6 | 1,376.0 | 1,479.7 |
| EBITDA, % | 9.39 | 11.24 | 11.25 | 11.74 | 0.50249 | 8.82 | 8.82 | 8.82 | 8.82 | 8.82 |
| Depreciation | 272.0 | 281.8 | 269.6 | 289.9 | 332.2 | 313.4 | 337.0 | 362.4 | 389.7 | 419.1 |
| Depreciation, % | 2.97 | 2.53 | 2.13 | 2.01 | 2.85 | 2.5 | 2.5 | 2.5 | 2.5 | 2.5 |
| EBIT | 586.9 | 969.7 | 1,153.2 | 1,402.3 | -273.6 | 793.1 | 852.9 | 917.2 | 986.3 | 1,060.6 |
| EBIT, % | 6.41 | 8.71 | 9.12 | 9.73 | -2.35 | 6.32 | 6.32 | 6.32 | 6.32 | 6.32 |
| Total Cash | 1,111.7 | 882.2 | 787.5 | 595.0 | 612.0 | 894.7 | 962.2 | 1,034.7 | 1,112.7 | 1,196.6 |
| Total Cash, percent | .0 | .0 | .0 | .0 | .0 | .0 | .0 | .0 | .0 | .0 |
| Account Receivables | 856.0 | 991.5 | 1,221.3 | 1,605.3 | 1,267.4 | 1,252.0 | 1,346.4 | 1,447.9 | 1,557.0 | 1,674.4 |
| Account Receivables, % | 9.36 | 8.9 | 9.65 | 11.14 | 10.87 | 9.98 | 9.98 | 9.98 | 9.98 | 9.98 |
| Inventories | 1,974.4 | 2,593.7 | 3,189.7 | 3,440.7 | 2,731.3 | 2,943.9 | 3,165.8 | 3,404.5 | 3,661.1 | 3,937.1 |
| Inventories, % | 21.58 | 23.29 | 25.21 | 23.87 | 23.42 | 23.47 | 23.47 | 23.47 | 23.47 | 23.47 |
| Accounts Payable | 855.1 | 1,078.3 | 1,385.3 | 1,207.3 | 813.0 | 1,136.8 | 1,222.5 | 1,314.7 | 1,413.8 | 1,520.4 |
| Accounts Payable, % | 9.35 | 9.68 | 10.95 | 8.38 | 6.97 | 9.06 | 9.06 | 9.06 | 9.06 | 9.06 |
| Capital Expenditure | -269.9 | -269.8 | -388.3 | -518.1 | -393.3 | -386.5 | -415.6 | -446.9 | -480.6 | -516.9 |
| Capital Expenditure, % | -2.95 | -2.42 | -3.07 | -3.59 | -3.37 | -3.08 | -3.08 | -3.08 | -3.08 | -3.08 |
| Tax Rate, % | -9.71 | -9.71 | -9.71 | -9.71 | -9.71 | -9.71 | -9.71 | -9.71 | -9.71 | -9.71 |
| EBITAT | 412.6 | 861.3 | 875.9 | 1,171.9 | -300.2 | 664.0 | 714.1 | 767.9 | 825.8 | 888.1 |
| Depreciation | ||||||||||
| Changes in Account Receivables | ||||||||||
| Changes in Inventories | ||||||||||
| Changes in Accounts Payable | ||||||||||
| Capital Expenditure | ||||||||||
| UFCF | -1,560.6 | 341.7 | 238.4 | 130.7 | 291.7 | 717.5 | 404.9 | 435.4 | 468.2 | 503.5 |
| WACC, % | 7.96 | 8.24 | 8.05 | 8.16 | 8.41 | 8.16 | 8.16 | 8.16 | 8.16 | 8.16 |
| PV UFCF | ||||||||||
| SUM PV UFCF | 2,035.6 | |||||||||
| Long Term Growth Rate, % | 2.00 | |||||||||
| Free cash flow (T + 1) | 514 | |||||||||
| Terminal Value | 8,332 | |||||||||
| Present Terminal Value | 5,627 | |||||||||
| Enterprise Value | 7,663 | |||||||||
| Net Debt | 2,164 | |||||||||
| Equity Value | 5,499 | |||||||||
| Diluted Shares Outstanding, MM | 75 | |||||||||
| Equity Value Per Share | 73.62 |
What You Will Receive
- Comprehensive Financial Model: AGCO Corporation’s actual data facilitates accurate DCF valuation.
- Complete Forecast Control: Modify revenue growth, profit margins, WACC, and other essential drivers.
- Real-Time Calculations: Instant updates ensure you can view results as you adjust inputs.
- Professional-Grade Template: A polished Excel file crafted for high-quality valuation.
- Flexible and Reusable: Designed for customization, enabling repeated application for in-depth forecasts.
Key Features
- Comprehensive Historical Data: AGCO Corporation’s (AGCO) past financial reports and projected forecasts.
- Customizable Parameters: Adjust WACC, tax rates, revenue growth, and EBITDA margins as needed.
- Real-Time Insights: Observe AGCO’s intrinsic value updating instantly.
- Intuitive Visual Outputs: Dashboard graphs present valuation outcomes and essential metrics.
- Designed for Precision: A reliable tool tailored for analysts, investors, and finance professionals.
How It Works
- Step 1: Download the Excel file for AGCO Corporation (AGCO).
- Step 2: Review AGCO's pre-filled financial data and forecasts.
- Step 3: Modify key inputs such as revenue growth, WACC, and tax rates (highlighted cells).
- Step 4: Observe the DCF model update in real-time as you adjust your assumptions.
- Step 5: Analyze the results and leverage the insights for your investment decisions.
Why Choose This Calculator for AGCO Corporation (AGCO)?
- Precision: Utilizes real AGCO financial data to ensure accuracy.
- Versatility: Crafted for users to easily adjust and test various inputs.
- Efficiency: Eliminate the need to construct a DCF model from the ground up.
- Expert-Level: Built with the precision and usability expected at the CFO level.
- Intuitive: Simple to navigate, suitable for users without extensive financial modeling skills.
Who Should Use This Product?
- Professional Investors: Create comprehensive and accurate valuation models for assessing AGCO's performance.
- Corporate Finance Teams: Evaluate valuation scenarios to inform strategic decision-making within the company.
- Consultants and Advisors: Deliver precise valuation insights for clients interested in AGCO (AGCO).
- Students and Educators: Utilize real-world data to learn and teach financial modeling techniques related to AGCO.
- Agriculture Enthusiasts: Gain insights into how agricultural companies like AGCO (AGCO) are valued in the investment landscape.
What the AGCO Template Contains
- Preloaded AGCO Data: Historical and projected financial data, including revenue, EBIT, and capital expenditures.
- DCF and WACC Models: Professional-grade sheets for calculating intrinsic value and Weighted Average Cost of Capital.
- Editable Inputs: Yellow-highlighted cells for adjusting revenue growth, tax rates, and discount rates.
- Financial Statements: Comprehensive annual and quarterly financials for deeper analysis.
- Key Ratios: Profitability, leverage, and efficiency ratios to evaluate performance.
- Dashboard and Charts: Visual summaries of valuation outcomes and assumptions.
Disclaimer
All information, articles, and product details provided on this website are for general informational and educational purposes only. We do not claim any ownership over, nor do we intend to infringe upon, any trademarks, copyrights, logos, brand names, or other intellectual property mentioned or depicted on this site. Such intellectual property remains the property of its respective owners, and any references here are made solely for identification or informational purposes, without implying any affiliation, endorsement, or partnership.
We make no representations or warranties, express or implied, regarding the accuracy, completeness, or suitability of any content or products presented. Nothing on this website should be construed as legal, tax, investment, financial, medical, or other professional advice. In addition, no part of this site—including articles or product references—constitutes a solicitation, recommendation, endorsement, advertisement, or offer to buy or sell any securities, franchises, or other financial instruments, particularly in jurisdictions where such activity would be unlawful.
All content is of a general nature and may not address the specific circumstances of any individual or entity. It is not a substitute for professional advice or services. Any actions you take based on the information provided here are strictly at your own risk. You accept full responsibility for any decisions or outcomes arising from your use of this website and agree to release us from any liability in connection with your use of, or reliance upon, the content or products found herein.