
|
Avaliação DCF da Argan, Inc. (AGX) |
Totalmente Editável: Adapte-Se Às Suas Necessidades No Excel Ou Planilhas
Design Profissional: Modelos Confiáveis E Padrão Da Indústria
Pré-Construídos Para Uso Rápido E Eficiente
Compatível com MAC/PC, totalmente desbloqueado
Não É Necessária Experiência; Fácil De Seguir
Argan, Inc. (AGX) Bundle
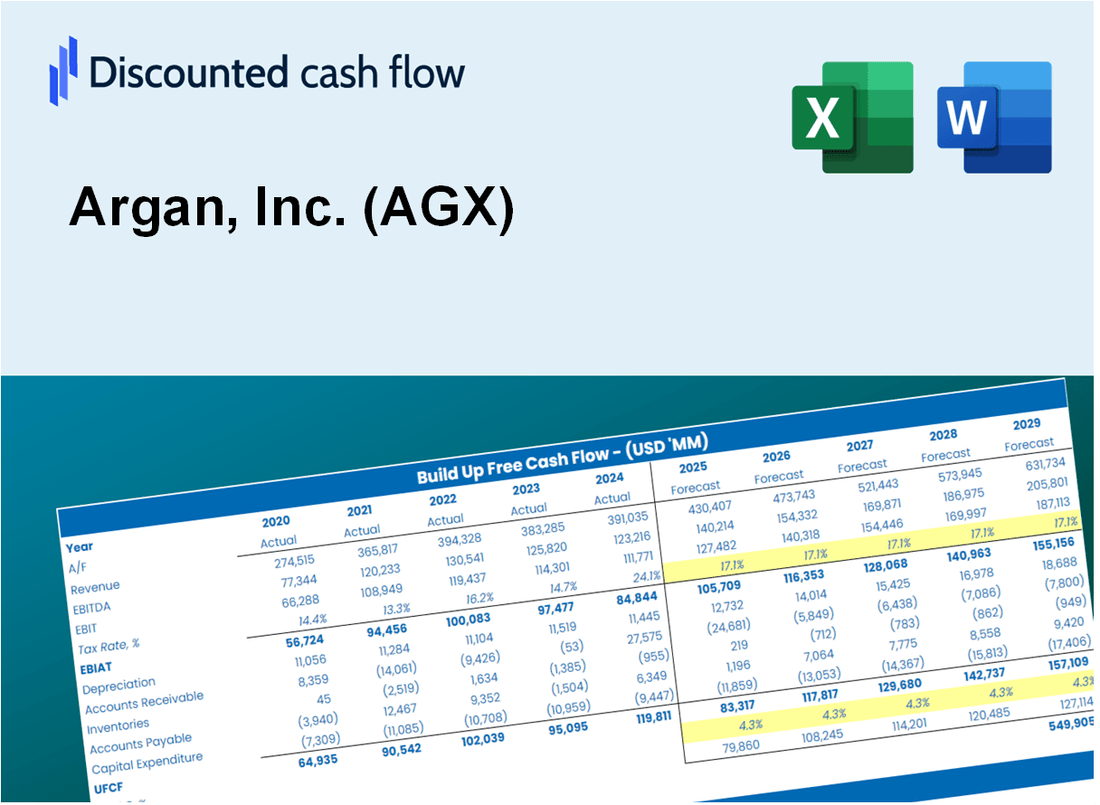
Simplifique sua análise financeira e melhore a precisão com a nossa calculadora DCF (AGX)! Utilizando dados atualizados da Argan, Inc. e suposições personalizáveis, essa ferramenta o capacita a prever, analisar e avaliar (AGX), assim como um investidor especialista.
Discounted Cash Flow (DCF) - (USD MM)
| Year | AY1 2021 |
AY2 2022 |
AY3 2023 |
AY4 2024 |
AY5 2025 |
FY1 2026 |
FY2 2027 |
FY3 2028 |
FY4 2029 |
FY5 2030 |
|---|---|---|---|---|---|---|---|---|---|---|
| Revenue | 392.2 | 509.4 | 455.0 | 573.3 | 874.2 | 1,087.6 | 1,353.2 | 1,683.7 | 2,094.8 | 2,606.4 |
| Revenue Growth, % | 0 | 29.87 | -10.67 | 26 | 52.47 | 24.42 | 24.42 | 24.42 | 24.42 | 24.42 |
| EBITDA | 27.6 | 56.6 | 45.4 | 38.9 | 93.9 | 99.3 | 123.6 | 153.7 | 191.3 | 238.0 |
| EBITDA, % | 7.05 | 11.12 | 9.97 | 6.78 | 10.74 | 9.13 | 9.13 | 9.13 | 9.13 | 9.13 |
| Depreciation | 4.6 | 4.2 | 3.7 | 2.4 | 5.7 | 8.5 | 10.5 | 13.1 | 16.3 | 20.3 |
| Depreciation, % | 1.18 | 0.83181 | 0.81641 | 0.41948 | 0.64746 | 0.77857 | 0.77857 | 0.77857 | 0.77857 | 0.77857 |
| EBIT | 23.0 | 52.4 | 41.7 | 36.5 | 88.2 | 90.9 | 113.0 | 140.6 | 175.0 | 217.7 |
| EBIT, % | 5.87 | 10.29 | 9.16 | 6.36 | 10.09 | 8.35 | 8.35 | 8.35 | 8.35 | 8.35 |
| Total Cash | 456.7 | 440.5 | 325.5 | 412.4 | 525.1 | 848.4 | 1,055.5 | 1,313.3 | 1,634.0 | 2,033.0 |
| Total Cash, percent | .0 | .0 | .0 | .0 | .0 | .0 | .0 | .0 | .0 | .0 |
| Account Receivables | 55.3 | 31.9 | 74.9 | 95.5 | 209.3 | 168.4 | 209.6 | 260.7 | 324.4 | 403.6 |
| Account Receivables, % | 14.11 | 6.26 | 16.46 | 16.66 | 23.94 | 15.49 | 15.49 | 15.49 | 15.49 | 15.49 |
| Inventories | .0 | .7 | 11.9 | 10.0 | .3 | 9.9 | 12.3 | 15.3 | 19.0 | 23.7 |
| Inventories, % | 0 | 0.14488 | 2.62 | 1.74 | 0.03660578 | 0.90778 | 0.90778 | 0.90778 | 0.90778 | 0.90778 |
| Accounts Payable | 53.3 | 41.8 | 56.4 | 39.5 | 97.3 | 113.6 | 141.3 | 175.8 | 218.7 | 272.1 |
| Accounts Payable, % | 13.59 | 8.21 | 12.39 | 6.89 | 11.13 | 10.44 | 10.44 | 10.44 | 10.44 | 10.44 |
| Capital Expenditure | -1.7 | -1.4 | -3.4 | -2.8 | -6.6 | -5.8 | -7.3 | -9.0 | -11.3 | -14.0 |
| Capital Expenditure, % | -0.43268 | -0.27917 | -0.74103 | -0.4807 | -0.75305 | -0.53733 | -0.53733 | -0.53733 | -0.53733 | -0.53733 |
| Tax Rate, % | 23.15 | 23.15 | 23.15 | 23.15 | 23.15 | 23.15 | 23.15 | 23.15 | 23.15 | 23.15 |
| EBITAT | 22.1 | 42.6 | 30.0 | 24.1 | 67.8 | 71.2 | 88.6 | 110.3 | 137.2 | 170.7 |
| Depreciation | ||||||||||
| Changes in Account Receivables | ||||||||||
| Changes in Inventories | ||||||||||
| Changes in Accounts Payable | ||||||||||
| Capital Expenditure | ||||||||||
| UFCF | 22.9 | 56.7 | -9.3 | -11.8 | 20.6 | 121.4 | 76.1 | 94.7 | 117.8 | 146.5 |
| WACC, % | 6.64 | 6.64 | 6.64 | 6.64 | 6.64 | 6.64 | 6.64 | 6.64 | 6.64 | 6.64 |
| PV UFCF | ||||||||||
| SUM PV UFCF | 456.1 | |||||||||
| Long Term Growth Rate, % | 0.50 | |||||||||
| Free cash flow (T + 1) | 147 | |||||||||
| Terminal Value | 2,399 | |||||||||
| Present Terminal Value | 1,740 | |||||||||
| Enterprise Value | 2,196 | |||||||||
| Net Debt | -140 | |||||||||
| Equity Value | 2,336 | |||||||||
| Diluted Shares Outstanding, MM | 14 | |||||||||
| Equity Value Per Share | 167.97 |
What You Will Receive
- Comprehensive Financial Model: Argan, Inc.'s (AGX) actual data allows for accurate DCF valuation.
- Complete Forecast Control: Modify revenue growth, profit margins, WACC, and other essential factors.
- Real-Time Calculations: Automatic updates provide immediate insights as you adjust parameters.
- Professional-Grade Template: A polished Excel file crafted for high-quality valuation.
- Flexible and Reusable: Designed for adaptability, enabling consistent use for in-depth forecasts.
Key Features
- Customizable Financial Inputs: Adjust essential parameters such as revenue growth, EBITDA %, and capital expenditures.
- Instant DCF Valuation: Automatically computes intrinsic value, NPV, and other key metrics in real time.
- High-Precision Accuracy: Leverages Argan, Inc.'s (AGX) actual financial data for dependable valuation results.
- Effortless Scenario Analysis: Easily evaluate various assumptions and analyze different outcomes.
- Efficiency Booster: Streamline your process by avoiding the creation of intricate valuation models from the ground up.
How It Works
- Step 1: Download the Excel file for Argan, Inc. (AGX).
- Step 2: Review Argan’s pre-filled financial data and forecasts.
- Step 3: Modify key inputs such as revenue growth, WACC, and tax rates (highlighted cells).
- Step 4: Observe the DCF model update in real-time as you adjust your assumptions.
- Step 5: Analyze the outputs and leverage the results for your investment decisions.
Why Choose the Argan, Inc. (AGX) Calculator?
- All-in-One Solution: Features DCF, WACC, and financial ratio analyses seamlessly integrated.
- Flexible Inputs: Modify the highlighted cells to explore different financial scenarios.
- In-Depth Analysis: Automatically computes Argan, Inc.’s intrinsic value and Net Present Value.
- Preloaded Information: Access historical and projected data for precise calculations.
- Expert-Level Tool: Perfect for financial analysts, investors, and business advisors.
Who Should Use This Product?
- Individual Investors: Make informed decisions about buying or selling Argan, Inc. (AGX) stock.
- Financial Analysts: Streamline valuation processes with ready-to-use financial models for Argan, Inc. (AGX).
- Consultants: Deliver professional valuation insights on Argan, Inc. (AGX) to clients quickly and accurately.
- Business Owners: Understand how companies like Argan, Inc. (AGX) are valued to guide your own strategy.
- Finance Students: Learn valuation techniques using real-world data and scenarios related to Argan, Inc. (AGX).
What the Template Contains
- Preloaded AGX Data: Historical and projected financial data, including revenue, EBIT, and capital expenditures.
- DCF and WACC Models: Professional-grade sheets for calculating intrinsic value and Weighted Average Cost of Capital.
- Editable Inputs: Yellow-highlighted cells for adjusting revenue growth, tax rates, and discount rates.
- Financial Statements: Comprehensive annual and quarterly financials for deeper analysis.
- Key Ratios: Profitability, leverage, and efficiency ratios to evaluate performance.
- Dashboard and Charts: Visual summaries of valuation outcomes and assumptions.
Disclaimer
All information, articles, and product details provided on this website are for general informational and educational purposes only. We do not claim any ownership over, nor do we intend to infringe upon, any trademarks, copyrights, logos, brand names, or other intellectual property mentioned or depicted on this site. Such intellectual property remains the property of its respective owners, and any references here are made solely for identification or informational purposes, without implying any affiliation, endorsement, or partnership.
We make no representations or warranties, express or implied, regarding the accuracy, completeness, or suitability of any content or products presented. Nothing on this website should be construed as legal, tax, investment, financial, medical, or other professional advice. In addition, no part of this site—including articles or product references—constitutes a solicitation, recommendation, endorsement, advertisement, or offer to buy or sell any securities, franchises, or other financial instruments, particularly in jurisdictions where such activity would be unlawful.
All content is of a general nature and may not address the specific circumstances of any individual or entity. It is not a substitute for professional advice or services. Any actions you take based on the information provided here are strictly at your own risk. You accept full responsibility for any decisions or outcomes arising from your use of this website and agree to release us from any liability in connection with your use of, or reliance upon, the content or products found herein.