
|
AIA Engineering Limited (AIAENG.NS) Avaliação DCF |
Totalmente Editável: Adapte-Se Às Suas Necessidades No Excel Ou Planilhas
Design Profissional: Modelos Confiáveis E Padrão Da Indústria
Pré-Construídos Para Uso Rápido E Eficiente
Compatível com MAC/PC, totalmente desbloqueado
Não É Necessária Experiência; Fácil De Seguir
AIA Engineering Limited (AIAENG.NS) Bundle
Simplifique a avaliação da AIA Engineering Limited (AIANGNS) com esta calculadora DCF personalizável! Apresentando o Real Engineering Limited Limited (AIAENGNS) e contribuições de previsão ajustáveis, você pode testar cenários e descobrir o valor justo da AIA Engineering Limited (AIAENGNS) em minutos.
Benefits You Will Receive
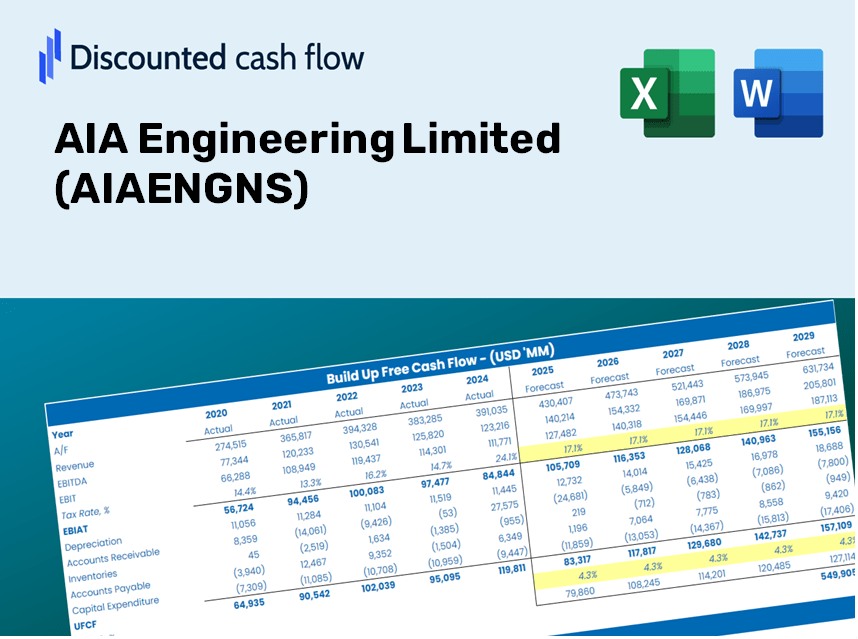
- Authentic AIAENGNS Financial Data: Automatically filled with AIA Engineering Limited’s historical and future projections for accurate analysis.
- Completely Customizable Template: Easily adjust key variables such as revenue growth, WACC, and EBITDA percentage.
- Instantaneous Calculations: Observe immediate updates to AIA Engineering Limited’s intrinsic value as you make adjustments.
- Professional Valuation Toolkit: Tailored for investors, analysts, and consultants in need of reliable DCF outputs.
- Intuitive User Interface: Streamlined layout and straightforward directions suitable for users of all proficiency levels.
Key Features
- Pre-Loaded Data: AIA Engineering Limited's historical financial statements and pre-filled forecasts.
- Fully Adjustable Inputs: Modify WACC, tax rates, revenue growth, and EBITDA margins as needed.
- Instant Results: Watch AIA Engineering Limited's intrinsic value update in real time.
- Clear Visual Outputs: Dashboard charts present valuation results and essential metrics.
- Built for Accuracy: A professional tool tailored for analysts, investors, and finance specialists.
How It Works
- Step 1: Download the Excel file for AIA Engineering Limited (AIAENGNS).
- Step 2: Examine the pre-filled financial data and forecasts provided for AIA Engineering.
- Step 3: Adjust key inputs such as revenue growth, WACC, and tax rates (highlighted cells).
- Step 4: Observe how the DCF model updates in real-time as you modify assumptions.
- Step 5: Evaluate the outputs and leverage the results for your investment decisions.
Why Choose AIA Engineering Limited (AIAENGNS)?
- Time-Saving Solutions: Our resources are ready to use, eliminating the need to start from scratch.
- Enhanced Accuracy: Dependable financial data and formulas minimize valuation errors.
- Completely Customizable: Adjust the model to align with your unique assumptions and forecasts.
- User-Friendly: Intuitive charts and outputs simplify the analysis of results.
- Preferred by Professionals: Developed for experts who prioritize precision and ease of use.
Who Can Benefit from This Product?
- Investors: Effectively assess AIA Engineering Limited's (AIAENGNS) intrinsic value prior to making investment choices.
- CFOs: Utilize a high-caliber DCF model for accurate financial reporting and analysis.
- Consultants: Seamlessly customize the template for client valuation reports.
- Entrepreneurs: Acquire knowledge on financial modeling practices used by leading companies.
- Educators: Implement this tool to illustrate valuation techniques in the classroom.
What the Template Includes
- Preloaded AIAENGNS Data: Historical and projected financial data, encompassing revenue, EBIT, and capital expenditures.
- DCF and WACC Models: Professional-grade spreadsheets designed for calculating intrinsic value and Weighted Average Cost of Capital.
- Editable Inputs: Yellow-highlighted cells for customizing revenue growth, tax rates, and discount rates.
- Financial Statements: Detailed annual and quarterly financial statements for comprehensive analysis.
- Key Ratios: Profitability, leverage, and efficiency ratios for performance assessment.
- Dashboard and Charts: Visual representations of valuation results and underlying assumptions.
Disclaimer
All information, articles, and product details provided on this website are for general informational and educational purposes only. We do not claim any ownership over, nor do we intend to infringe upon, any trademarks, copyrights, logos, brand names, or other intellectual property mentioned or depicted on this site. Such intellectual property remains the property of its respective owners, and any references here are made solely for identification or informational purposes, without implying any affiliation, endorsement, or partnership.
We make no representations or warranties, express or implied, regarding the accuracy, completeness, or suitability of any content or products presented. Nothing on this website should be construed as legal, tax, investment, financial, medical, or other professional advice. In addition, no part of this site—including articles or product references—constitutes a solicitation, recommendation, endorsement, advertisement, or offer to buy or sell any securities, franchises, or other financial instruments, particularly in jurisdictions where such activity would be unlawful.
All content is of a general nature and may not address the specific circumstances of any individual or entity. It is not a substitute for professional advice or services. Any actions you take based on the information provided here are strictly at your own risk. You accept full responsibility for any decisions or outcomes arising from your use of this website and agree to release us from any liability in connection with your use of, or reliance upon, the content or products found herein.