
|
American International Group, Inc. (AIG) Avaliação DCF |
Totalmente Editável: Adapte-Se Às Suas Necessidades No Excel Ou Planilhas
Design Profissional: Modelos Confiáveis E Padrão Da Indústria
Pré-Construídos Para Uso Rápido E Eficiente
Compatível com MAC/PC, totalmente desbloqueado
Não É Necessária Experiência; Fácil De Seguir
American International Group, Inc. (AIG) Bundle
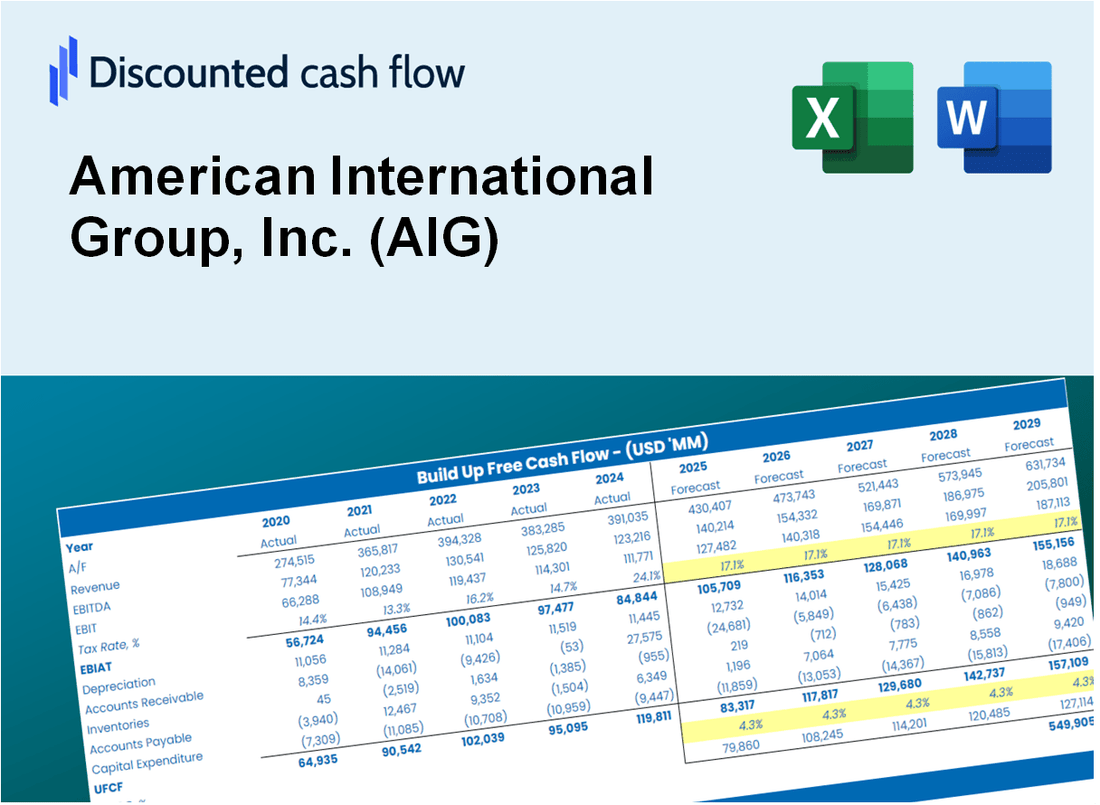
Projetado para precisão, nossa calculadora DCF (AIG) capacita você a avaliar a avaliação do American International Group, Inc. usando dados financeiros do mundo real, permitindo flexibilidade completa para modificar todos os parâmetros essenciais para projeções aprimoradas.
Discounted Cash Flow (DCF) - (USD MM)
| Year | AY1 2020 |
AY2 2021 |
AY3 2022 |
AY4 2023 |
AY5 2024 |
FY1 2025 |
FY2 2026 |
FY3 2027 |
FY4 2028 |
FY5 2029 |
|---|---|---|---|---|---|---|---|---|---|---|
| Revenue | 43,839.0 | 51,959.0 | 54,768.0 | 47,251.0 | 27,274.0 | 25,087.0 | 23,075.3 | 21,224.9 | 19,522.9 | 17,957.4 |
| Revenue Growth, % | 0 | 18.52 | 5.41 | -13.73 | -42.28 | -8.02 | -8.02 | -8.02 | -8.02 | -8.02 |
| EBITDA | -3,173.0 | 17,889.0 | 18,708.0 | 8,072.0 | 7,467.0 | 5,308.9 | 4,883.2 | 4,491.7 | 4,131.5 | 3,800.2 |
| EBITDA, % | -7.24 | 34.43 | 34.16 | 17.08 | 27.38 | 21.16 | 21.16 | 21.16 | 21.16 | 21.16 |
| Depreciation | 4,120.0 | 4,542.0 | 4,409.0 | 4,214.0 | 3,597.0 | 2,423.2 | 2,228.9 | 2,050.2 | 1,885.8 | 1,734.6 |
| Depreciation, % | 9.4 | 8.74 | 8.05 | 8.92 | 13.19 | 9.66 | 9.66 | 9.66 | 9.66 | 9.66 |
| EBIT | -7,293.0 | 13,347.0 | 14,299.0 | 3,858.0 | 3,870.0 | 2,885.7 | 2,654.3 | 2,441.5 | 2,245.7 | 2,065.6 |
| EBIT, % | -16.64 | 25.69 | 26.11 | 8.16 | 14.19 | 11.5 | 11.5 | 11.5 | 11.5 | 11.5 |
| Total Cash | 292,526.0 | 292,757.0 | 240,575.0 | 2,155.0 | 15,764.0 | 18,181.0 | 16,723.1 | 15,382.1 | 14,148.6 | 13,014.1 |
| Total Cash, percent | .0 | .0 | .0 | .0 | .0 | .0 | .0 | .0 | .0 | .0 |
| Account Receivables | 11,333.0 | 12,409.0 | 13,243.0 | 10,561.0 | 3,868.0 | 5,541.5 | 5,097.2 | 4,688.4 | 4,312.5 | 3,966.7 |
| Account Receivables, % | 25.85 | 23.88 | 24.18 | 22.35 | 14.18 | 22.09 | 22.09 | 22.09 | 22.09 | 22.09 |
| Inventories | .0 | .0 | .0 | .0 | .0 | .0 | .0 | .0 | .0 | .0 |
| Inventories, % | 0 | 0 | 0 | 0 | 0 | 0 | 0 | 0 | 0 | 0 |
| Accounts Payable | .0 | .0 | .0 | .0 | .0 | .0 | .0 | .0 | .0 | .0 |
| Accounts Payable, % | 0 | 0 | 0 | 0 | 0 | 0 | 0 | 0 | 0 | 0 |
| Capital Expenditure | .0 | .0 | .0 | .0 | .0 | .0 | .0 | .0 | .0 | .0 |
| Capital Expenditure, % | 0 | 0 | 0 | 0 | 0 | 0 | 0 | 0 | 0 | 0 |
| Tax Rate, % | 136.28 | 136.28 | 136.28 | 136.28 | 136.28 | 136.28 | 136.28 | 136.28 | 136.28 | 136.28 |
| EBITAT | -5,944.0 | 10,367.0 | 10,227.0 | 3,643.0 | -1,404.0 | 1,876.4 | 1,726.0 | 1,587.6 | 1,460.3 | 1,343.2 |
| Depreciation | ||||||||||
| Changes in Account Receivables | ||||||||||
| Changes in Inventories | ||||||||||
| Changes in Accounts Payable | ||||||||||
| Capital Expenditure | ||||||||||
| UFCF | -13,157.0 | 13,833.0 | 13,802.0 | 10,539.0 | 8,886.0 | 2,626.1 | 4,399.2 | 4,046.5 | 3,722.0 | 3,423.5 |
| WACC, % | 6.35 | 6.32 | 6.27 | 6.44 | 5.73 | 6.22 | 6.22 | 6.22 | 6.22 | 6.22 |
| PV UFCF | ||||||||||
| SUM PV UFCF | 15,203.2 | |||||||||
| Long Term Growth Rate, % | 2.00 | |||||||||
| Free cash flow (T + 1) | 3,492 | |||||||||
| Terminal Value | 82,730 | |||||||||
| Present Terminal Value | 61,180 | |||||||||
| Enterprise Value | 76,384 | |||||||||
| Net Debt | 7,620 | |||||||||
| Equity Value | 68,764 | |||||||||
| Diluted Shares Outstanding, MM | 657 | |||||||||
| Equity Value Per Share | 104.62 |
What You Will Get
- Pre-Filled Financial Model: AIG’s actual data enables precise DCF valuation.
- Full Forecast Control: Adjust revenue growth, margins, WACC, and other key drivers.
- Instant Calculations: Automatic updates ensure you see results as you make changes.
- Investor-Ready Template: A refined Excel file designed for professional-grade valuation.
- Customizable and Reusable: Tailored for flexibility, allowing repeated use for detailed forecasts.
Key Features
- Customizable Risk Parameters: Adjust essential inputs such as premium growth, loss ratios, and expense ratios.
- Instant Valuation Metrics: Provides quick calculations of intrinsic value, NPV, and other key financial indicators.
- Industry-Leading Precision: Leverages AIG's real-world financial data for accurate valuation results.
- Effortless Scenario Testing: Easily analyze various assumptions and evaluate different outcomes.
- Efficiency Booster: Streamline the valuation process without the need to create intricate models from the ground up.
How It Works
- Download: Obtain the pre-configured Excel file containing American International Group, Inc.'s (AIG) financial data.
- Customize: Modify projections, such as revenue growth, EBITDA %, and WACC.
- Update Automatically: The intrinsic value and NPV calculations refresh in real-time.
- Test Scenarios: Generate various forecasts and instantly compare results.
- Make Decisions: Leverage the valuation findings to inform your investment strategy.
Why Choose This Calculator for AIG?
- Designed for Experts: A sophisticated tool favored by analysts, CFOs, and consultants in the industry.
- Accurate Financials: AIG’s historical and projected financial data preloaded for precision.
- Flexible Scenario Analysis: Effortlessly simulate various forecasts and assumptions.
- Comprehensive Outputs: Automatically computes intrinsic value, NPV, and essential metrics.
- User-Friendly: Step-by-step guidance ensures a smooth experience throughout the process.
Who Should Use This Product?
- Finance Students: Explore risk management strategies and apply them using real-world data related to American International Group, Inc. (AIG).
- Academics: Integrate advanced insurance models into your research or teaching materials.
- Investors: Evaluate your investment hypotheses and analyze the performance metrics for American International Group, Inc. (AIG).
- Analysts: Enhance your efficiency with a ready-to-use, adaptable financial model tailored for insurance companies.
- Small Business Owners: Understand how large insurance firms like American International Group, Inc. (AIG) assess risk and manage portfolios.
What the Template Contains
- Comprehensive DCF Model: Editable template with detailed valuation calculations tailored for American International Group, Inc. (AIG).
- Real-World Data: AIG’s historical and projected financials preloaded for thorough analysis.
- Customizable Parameters: Adjust WACC, growth rates, and tax assumptions to explore various scenarios.
- Financial Statements: Complete annual and quarterly breakdowns for enhanced insights.
- Key Ratios: Integrated analysis for profitability, efficiency, and leverage metrics.
- Dashboard with Visual Outputs: Charts and tables providing clear, actionable results.
Disclaimer
All information, articles, and product details provided on this website are for general informational and educational purposes only. We do not claim any ownership over, nor do we intend to infringe upon, any trademarks, copyrights, logos, brand names, or other intellectual property mentioned or depicted on this site. Such intellectual property remains the property of its respective owners, and any references here are made solely for identification or informational purposes, without implying any affiliation, endorsement, or partnership.
We make no representations or warranties, express or implied, regarding the accuracy, completeness, or suitability of any content or products presented. Nothing on this website should be construed as legal, tax, investment, financial, medical, or other professional advice. In addition, no part of this site—including articles or product references—constitutes a solicitation, recommendation, endorsement, advertisement, or offer to buy or sell any securities, franchises, or other financial instruments, particularly in jurisdictions where such activity would be unlawful.
All content is of a general nature and may not address the specific circumstances of any individual or entity. It is not a substitute for professional advice or services. Any actions you take based on the information provided here are strictly at your own risk. You accept full responsibility for any decisions or outcomes arising from your use of this website and agree to release us from any liability in connection with your use of, or reliance upon, the content or products found herein.