
|
L'Ar Liquide S.A. (AI.PA) Avaliação DCF |
Totalmente Editável: Adapte-Se Às Suas Necessidades No Excel Ou Planilhas
Design Profissional: Modelos Confiáveis E Padrão Da Indústria
Pré-Construídos Para Uso Rápido E Eficiente
Compatível com MAC/PC, totalmente desbloqueado
Não É Necessária Experiência; Fácil De Seguir
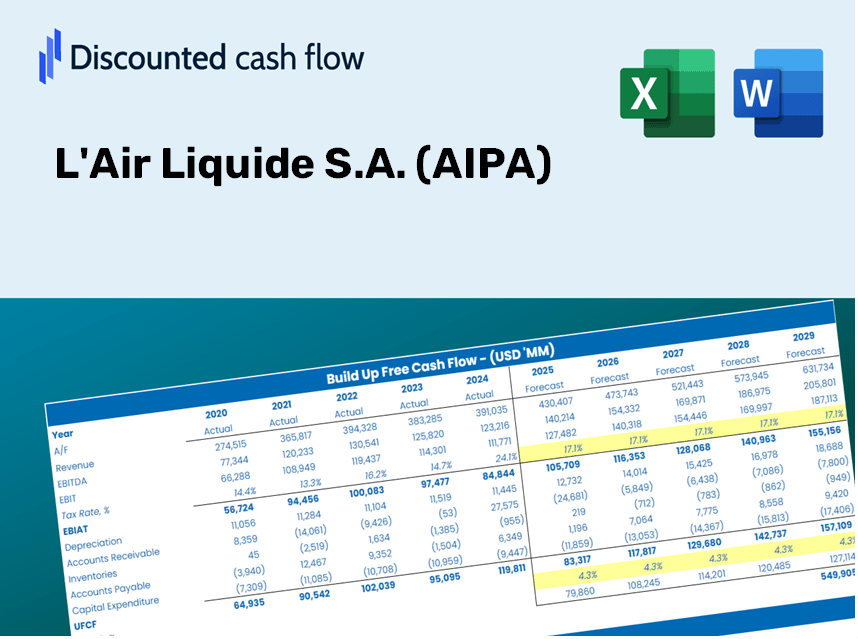
L'Air Liquide S.A. (AI.PA) Bundle
Descubra o verdadeiro valor de L'Air Liquide S.A. (AIPA) com nossa calculadora DCF avançada! Ajuste as suposições -chave, explore vários cenários e avalie como as flutuações afetam a avaliação L'Air Liquide S.A. (AIPA) - tudo em um modelo conveniente do Excel.
Discounted Cash Flow (DCF) - (USD MM)
| Year | AY1 2020 |
AY2 2021 |
AY3 2022 |
AY4 2023 |
AY5 2024 |
FY1 2025 |
FY2 2026 |
FY3 2027 |
FY4 2028 |
FY5 2029 |
|---|---|---|---|---|---|---|---|---|---|---|
| Revenue | 20,485.2 | 23,334.8 | 29,934.0 | 27,607.6 | 27,057.8 | 29,251.4 | 31,622.8 | 34,186.4 | 36,957.9 | 39,954.0 |
| Revenue Growth, % | 0 | 13.91 | 28.28 | -7.77 | -1.99 | 8.11 | 8.11 | 8.11 | 8.11 | 8.11 |
| EBITDA | 5,768.5 | 6,107.7 | 6,415.8 | 6,902.8 | 7,500.8 | 7,517.1 | 8,126.5 | 8,785.3 | 9,497.5 | 10,267.5 |
| EBITDA, % | 28.16 | 26.17 | 21.43 | 25 | 27.72 | 25.7 | 25.7 | 25.7 | 25.7 | 25.7 |
| Depreciation | 2,137.9 | 2,172.5 | 2,465.9 | 2,482.0 | 2,505.1 | 2,704.7 | 2,924.0 | 3,161.1 | 3,417.3 | 3,694.4 |
| Depreciation, % | 10.44 | 9.31 | 8.24 | 8.99 | 9.26 | 9.25 | 9.25 | 9.25 | 9.25 | 9.25 |
| EBIT | 3,630.6 | 3,935.2 | 3,949.9 | 4,420.8 | 4,995.7 | 4,812.3 | 5,202.5 | 5,624.2 | 6,080.2 | 6,573.1 |
| EBIT, % | 17.72 | 16.86 | 13.2 | 16.01 | 18.46 | 16.45 | 16.45 | 16.45 | 16.45 | 16.45 |
| Total Cash | 1,791.4 | 2,246.6 | 1,911.4 | 1,624.7 | 1,915.3 | 2,206.8 | 2,385.7 | 2,579.1 | 2,788.2 | 3,014.2 |
| Total Cash, percent | .0 | .0 | .0 | .0 | .0 | .0 | .0 | .0 | .0 | .0 |
| Account Receivables | 2,296.2 | 2,694.1 | 3,034.8 | 2,993.7 | 2,996.7 | 3,206.6 | 3,466.6 | 3,747.6 | 4,051.4 | 4,379.9 |
| Account Receivables, % | 11.21 | 11.55 | 10.14 | 10.84 | 11.08 | 10.96 | 10.96 | 10.96 | 10.96 | 10.96 |
| Inventories | 1,405.9 | 1,585.1 | 1,961.0 | 2,027.6 | 2,189.6 | 2,085.2 | 2,254.3 | 2,437.1 | 2,634.6 | 2,848.2 |
| Inventories, % | 6.86 | 6.79 | 6.55 | 7.34 | 8.09 | 7.13 | 7.13 | 7.13 | 7.13 | 7.13 |
| Accounts Payable | 633.2 | 1,340.8 | 3,782.6 | 3,310.5 | 3,319.0 | 2,675.4 | 2,892.3 | 3,126.8 | 3,380.2 | 3,654.3 |
| Accounts Payable, % | 3.09 | 5.75 | 12.64 | 11.99 | 12.27 | 9.15 | 9.15 | 9.15 | 9.15 | 9.15 |
| Capital Expenditure | -2,630.2 | -2,916.8 | -3,273.0 | -3,393.4 | -3,525.1 | -3,603.4 | -3,895.5 | -4,211.3 | -4,552.7 | -4,921.8 |
| Capital Expenditure, % | -12.84 | -12.5 | -10.93 | -12.29 | -13.03 | -12.32 | -12.32 | -12.32 | -12.32 | -12.32 |
| Tax Rate, % | 26.97 | 26.97 | 26.97 | 26.97 | 26.97 | 26.97 | 26.97 | 26.97 | 26.97 | 26.97 |
| EBITAT | 2,754.0 | 2,810.7 | 2,790.4 | 3,274.7 | 3,648.2 | 3,513.3 | 3,798.1 | 4,106.0 | 4,438.9 | 4,798.7 |
| Depreciation | ||||||||||
| Changes in Account Receivables | ||||||||||
| Changes in Inventories | ||||||||||
| Changes in Accounts Payable | ||||||||||
| Capital Expenditure | ||||||||||
| UFCF | -807.2 | 2,196.9 | 3,708.5 | 1,865.7 | 2,471.7 | 1,865.5 | 2,614.5 | 2,826.5 | 3,055.6 | 3,303.3 |
| WACC, % | 6.57 | 6.55 | 6.55 | 6.56 | 6.56 | 6.56 | 6.56 | 6.56 | 6.56 | 6.56 |
| PV UFCF | ||||||||||
| SUM PV UFCF | 11,164.6 | |||||||||
| Long Term Growth Rate, % | 2.00 | |||||||||
| Free cash flow (T + 1) | 3,369 | |||||||||
| Terminal Value | 73,961 | |||||||||
| Present Terminal Value | 53,842 | |||||||||
| Enterprise Value | 65,007 | |||||||||
| Net Debt | 10,533 | |||||||||
| Equity Value | 54,474 | |||||||||
| Diluted Shares Outstanding, MM | 576 | |||||||||
| Equity Value Per Share | 94.50 |
Benefits You Will Experience
- Adjustable Forecast Inputs: Effortlessly modify key assumptions (growth %, margins, WACC) to explore various scenarios.
- Comprehensive Data: L'Air Liquide S.A. (AIPA) financial information pre-filled to facilitate your analysis.
- Automated DCF Outputs: The template computes Net Present Value (NPV) and intrinsic value automatically.
- Tailorable and Professional: A sleek Excel model designed to suit your valuation requirements.
- Designed for Analysts and Investors: Perfect for testing forecasts, validating strategies, and optimizing your time.
Key Features
- 🔍 Real-Life AIPA Financials: Pre-filled historical and projected data for L'Air Liquide S.A.
- ✏️ Fully Customizable Inputs: Modify all essential parameters (yellow cells) such as WACC, growth %, and tax rates.
- 📊 Professional DCF Valuation: Integrated formulas calculate L'Air Liquide’s intrinsic value using the Discounted Cash Flow method.
- ⚡ Instant Results: Visualize L'Air Liquide’s valuation immediately after making adjustments.
- Scenario Analysis: Evaluate and compare outcomes for various financial assumptions side-by-side.
How It Works
- Step 1: Download the Excel file.
- Step 2: Examine the pre-filled L'Air Liquide S.A. (AIPA) data (both historical and projected).
- Step 3: Modify key assumptions (highlighted cells in yellow) based on your insights.
- Step 4: Observe automatic recalculations for L'Air Liquide’s intrinsic value.
- Step 5: Utilize the results for investment analysis or reporting purposes.
Why Choose L'Air Liquide S.A. (AIPA) Calculator?
- Save Time: Skip the hassle of building a DCF model from the ground up – it’s readily available for your use.
- Enhance Accuracy: Dependable financial data and established formulas help minimize valuation errors.
- Completely Adaptable: Customize the model to align with your specific assumptions and forecasts.
- User-Friendly: Intuitive charts and outputs ensure the results are straightforward to understand.
- Endorsed by Professionals: Crafted for experts who prioritize both precision and ease of use.
Who Can Benefit from This Product?
- Investors: Accurately assess the fair value of L'Air Liquide S.A. (AIPA) before making investment choices.
- CFOs: Utilize a professional-grade DCF model for comprehensive financial analysis and reporting.
- Consultants: Efficiently customize the template for client valuation reports.
- Entrepreneurs: Discover financial modeling strategies employed by leading companies.
- Educators: Employ it as a resource to illustrate valuation techniques in the classroom.
Contents of the Template
- Preloaded AIPA Data: Historical and projected financial metrics, including revenue, EBIT, and capital expenditures.
- DCF and WACC Models: Professional-grade spreadsheets for calculating intrinsic value and Weighted Average Cost of Capital.
- Editable Inputs: Yellow-highlighted cells for customizing revenue growth, tax rates, and discount rates.
- Financial Statements: Comprehensive annual and quarterly financials for in-depth analysis.
- Key Ratios: Ratios focused on profitability, leverage, and efficiency to assess overall performance.
- Dashboard and Charts: Visual representations of valuation results and underlying assumptions.
Disclaimer
All information, articles, and product details provided on this website are for general informational and educational purposes only. We do not claim any ownership over, nor do we intend to infringe upon, any trademarks, copyrights, logos, brand names, or other intellectual property mentioned or depicted on this site. Such intellectual property remains the property of its respective owners, and any references here are made solely for identification or informational purposes, without implying any affiliation, endorsement, or partnership.
We make no representations or warranties, express or implied, regarding the accuracy, completeness, or suitability of any content or products presented. Nothing on this website should be construed as legal, tax, investment, financial, medical, or other professional advice. In addition, no part of this site—including articles or product references—constitutes a solicitation, recommendation, endorsement, advertisement, or offer to buy or sell any securities, franchises, or other financial instruments, particularly in jurisdictions where such activity would be unlawful.
All content is of a general nature and may not address the specific circumstances of any individual or entity. It is not a substitute for professional advice or services. Any actions you take based on the information provided here are strictly at your own risk. You accept full responsibility for any decisions or outcomes arising from your use of this website and agree to release us from any liability in connection with your use of, or reliance upon, the content or products found herein.