
|
Ajanta Pharma Limited (AJANTPHARM.NS) Avaliação DCF |
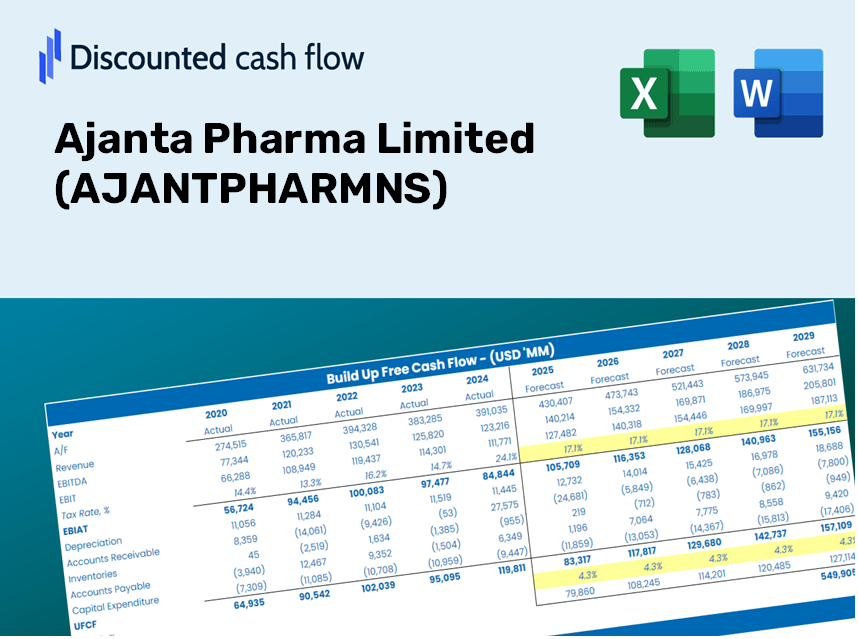
Totalmente Editável: Adapte-Se Às Suas Necessidades No Excel Ou Planilhas
Design Profissional: Modelos Confiáveis E Padrão Da Indústria
Pré-Construídos Para Uso Rápido E Eficiente
Compatível com MAC/PC, totalmente desbloqueado
Não É Necessária Experiência; Fácil De Seguir
Ajanta Pharma Limited (AJANTPHARM.NS) Bundle
Descubra o verdadeiro potencial da Ajanta Pharma Limited (Ajantpharmns) com nossa calculadora DCF avançada! Ajuste as principais suposições, explore vários cenários e avalie como diferentes fatores influenciam a avaliação da Ajanta Pharma - tudo dentro de um modelo conveniente do Excel.
Discounted Cash Flow (DCF) - (USD MM)
| Year | AY1 2021 |
AY2 2022 |
AY3 2023 |
AY4 2024 |
AY5 2025 |
FY1 2026 |
FY2 2027 |
FY3 2028 |
FY4 2029 |
FY5 2030 |
|---|---|---|---|---|---|---|---|---|---|---|
| Revenue | 28,470.2 | 32,841.3 | 37,426.4 | 42,087.1 | 46,481.0 | 52,547.7 | 59,406.1 | 67,159.8 | 75,925.4 | 85,835.1 |
| Revenue Growth, % | 0 | 15.35 | 13.96 | 12.45 | 10.44 | 13.05 | 13.05 | 13.05 | 13.05 | 13.05 |
| EBITDA | 10,240.5 | 10,444.9 | 8,814.0 | 12,565.4 | 12,683.2 | 15,603.1 | 17,639.6 | 19,941.9 | 22,544.7 | 25,487.2 |
| EBITDA, % | 35.97 | 31.8 | 23.55 | 29.86 | 27.29 | 29.69 | 29.69 | 29.69 | 29.69 | 29.69 |
| Depreciation | 1,156.0 | 1,248.1 | 1,303.1 | 1,354.0 | 1,441.1 | 1,856.0 | 2,098.2 | 2,372.1 | 2,681.7 | 3,031.7 |
| Depreciation, % | 4.06 | 3.8 | 3.48 | 3.22 | 3.1 | 3.53 | 3.53 | 3.53 | 3.53 | 3.53 |
| EBIT | 9,084.5 | 9,196.8 | 7,510.9 | 11,211.4 | 11,242.1 | 13,747.1 | 15,541.4 | 17,569.8 | 19,863.0 | 22,455.5 |
| EBIT, % | 31.91 | 28 | 20.07 | 26.64 | 24.19 | 26.16 | 26.16 | 26.16 | 26.16 | 26.16 |
| Total Cash | 3,781.8 | 3,282.2 | 8,436.5 | 4,595.4 | 6,149.5 | 7,353.3 | 8,313.1 | 9,398.1 | 10,624.7 | 12,011.4 |
| Total Cash, percent | .0 | .0 | .0 | .0 | .0 | .0 | .0 | .0 | .0 | .0 |
| Account Receivables | 7,384.3 | 10,198.1 | 10,569.0 | 12,468.4 | 11,827.4 | 14,744.9 | 16,669.4 | 18,845.0 | 21,304.7 | 24,085.3 |
| Account Receivables, % | 25.94 | 31.05 | 28.24 | 29.63 | 25.45 | 28.06 | 28.06 | 28.06 | 28.06 | 28.06 |
| Inventories | 7,664.7 | 7,910.7 | 8,156.3 | 8,283.6 | 9,038.5 | 11,763.3 | 13,298.7 | 15,034.4 | 16,996.7 | 19,215.0 |
| Inventories, % | 26.92 | 24.09 | 21.79 | 19.68 | 19.45 | 22.39 | 22.39 | 22.39 | 22.39 | 22.39 |
| Accounts Payable | 3,738.6 | 3,271.7 | 4,227.7 | 4,632.0 | 4,542.0 | 5,797.8 | 6,554.6 | 7,410.0 | 8,377.2 | 9,470.6 |
| Accounts Payable, % | 13.13 | 9.96 | 11.3 | 11.01 | 9.77 | 11.03 | 11.03 | 11.03 | 11.03 | 11.03 |
| Capital Expenditure | -1,716.1 | -1,488.4 | -1,744.9 | -1,524.1 | -3,179.2 | -2,699.2 | -3,051.5 | -3,449.7 | -3,900.0 | -4,409.0 |
| Capital Expenditure, % | -6.03 | -4.53 | -4.66 | -3.62 | -6.84 | -5.14 | -5.14 | -5.14 | -5.14 | -5.14 |
| Tax Rate, % | 22.6 | 22.6 | 22.6 | 22.6 | 22.6 | 22.6 | 22.6 | 22.6 | 22.6 | 22.6 |
| EBITAT | 6,598.8 | 7,206.7 | 5,925.9 | 8,214.5 | 8,701.2 | 10,463.3 | 11,829.0 | 13,372.9 | 15,118.3 | 17,091.5 |
| Depreciation | ||||||||||
| Changes in Account Receivables | ||||||||||
| Changes in Inventories | ||||||||||
| Changes in Accounts Payable | ||||||||||
| Capital Expenditure | ||||||||||
| UFCF | -5,271.7 | 3,439.7 | 5,823.6 | 6,422.0 | 6,759.2 | 5,233.7 | 8,172.6 | 9,239.3 | 10,445.2 | 11,808.5 |
| WACC, % | 4.58 | 4.58 | 4.58 | 4.58 | 4.58 | 4.58 | 4.58 | 4.58 | 4.58 | 4.58 |
| PV UFCF | ||||||||||
| SUM PV UFCF | 38,728.2 | |||||||||
| Long Term Growth Rate, % | 4.00 | |||||||||
| Free cash flow (T + 1) | 12,281 | |||||||||
| Terminal Value | 2,122,588 | |||||||||
| Present Terminal Value | 1,696,884 | |||||||||
| Enterprise Value | 1,735,612 | |||||||||
| Net Debt | -1,288 | |||||||||
| Equity Value | 1,736,900 | |||||||||
| Diluted Shares Outstanding, MM | 125 | |||||||||
| Equity Value Per Share | 13,876.11 |
Benefits of Using Our Model
- Flexible Input Options: Effortlessly adjust key parameters (growth %, margins, WACC) to generate various scenarios.
- Comprehensive Data: Ajanta Pharma Limited’s financial information pre-loaded to facilitate your analysis.
- Automated DCF Calculations: The template computes Net Present Value (NPV) and intrinsic value automatically.
- Professional and Tailored: A refined Excel model designed to meet your specific valuation requirements.
- Designed for Analysts and Investors: Perfect for evaluating projections, affirming strategies, and optimizing efficiency.
Key Features
- Accurate Financial Data: Gain access to reliable historical data and future forecasts for Ajanta Pharma Limited (AJANTPHARMNS).
- Adjustable Forecast Inputs: Modify highlighted fields for variables such as WACC, growth rates, and profit margins.
- Real-Time Calculations: Automatic recalibrations of DCF, Net Present Value (NPV), and cash flow assessments.
- User-Friendly Dashboard: Clear, concise charts and summaries for easy visualization of your valuation findings.
- Designed for All Users: An intuitive framework suited for investors, CFOs, and consultants, whether seasoned or new to the field.
How It Functions
- Download: Get the pre-prepared Excel file containing Ajanta Pharma Limited’s financial information.
- Customize: Modify forecasts such as revenue growth, EBITDA %, and WACC as per your analysis.
- Update Automatically: The intrinsic value and NPV calculations refresh in real-time.
- Test Scenarios: Generate various projections and compare results swiftly.
- Make Decisions: Leverage the valuation outcomes to inform your investment strategy.
Why Select This Calculator for Ajanta Pharma Limited (AJANTPHARMNS)?
- Precision: Utilizes actual Ajanta Pharma financial data to ensure reliable results.
- Versatility: Crafted to empower users to adjust and experiment with inputs as needed.
- Efficiency: Eliminate the need to create a DCF model from the ground up.
- Expert-Quality: Engineered with the accuracy and usability expectations of a CFO.
- Intuitive: Simple to operate, even for individuals with limited financial modeling skills.
Who Can Benefit from This Product?
- Investors: Evaluate Ajanta Pharma's valuation prior to making stock transactions.
- CFOs and Financial Analysts: Optimize valuation procedures and validate financial projections.
- Startup Founders: Gain insights into how leading public companies like Ajanta Pharma are valued.
- Consultants: Provide detailed valuation reports for your clients.
- Students and Educators: Utilize real-market data to practice and teach valuation methodologies.
Contents of the Template
- Pre-Populated Information: Contains Ajanta Pharma Limited’s historical financial data and projections.
- Discounted Cash Flow Model: An editable DCF valuation model with automatic computation capabilities.
- Weighted Average Cost of Capital (WACC): A specific sheet designed for calculating WACC based on user-defined inputs.
- Essential Financial Ratios: Assess Ajanta Pharma Limited’s profitability, operational efficiency, and financial leverage.
- Customizable Parameters: Easily modify revenue growth rates, profit margins, and tax rates.
- Comprehensive Dashboard: Visual representations and tables summarizing essential valuation outcomes.
Disclaimer
All information, articles, and product details provided on this website are for general informational and educational purposes only. We do not claim any ownership over, nor do we intend to infringe upon, any trademarks, copyrights, logos, brand names, or other intellectual property mentioned or depicted on this site. Such intellectual property remains the property of its respective owners, and any references here are made solely for identification or informational purposes, without implying any affiliation, endorsement, or partnership.
We make no representations or warranties, express or implied, regarding the accuracy, completeness, or suitability of any content or products presented. Nothing on this website should be construed as legal, tax, investment, financial, medical, or other professional advice. In addition, no part of this site—including articles or product references—constitutes a solicitation, recommendation, endorsement, advertisement, or offer to buy or sell any securities, franchises, or other financial instruments, particularly in jurisdictions where such activity would be unlawful.
All content is of a general nature and may not address the specific circumstances of any individual or entity. It is not a substitute for professional advice or services. Any actions you take based on the information provided here are strictly at your own risk. You accept full responsibility for any decisions or outcomes arising from your use of this website and agree to release us from any liability in connection with your use of, or reliance upon, the content or products found herein.