
|
ALIAT, Inc. (ALIT) Avaliação DCF |
Totalmente Editável: Adapte-Se Às Suas Necessidades No Excel Ou Planilhas
Design Profissional: Modelos Confiáveis E Padrão Da Indústria
Pré-Construídos Para Uso Rápido E Eficiente
Compatível com MAC/PC, totalmente desbloqueado
Não É Necessária Experiência; Fácil De Seguir
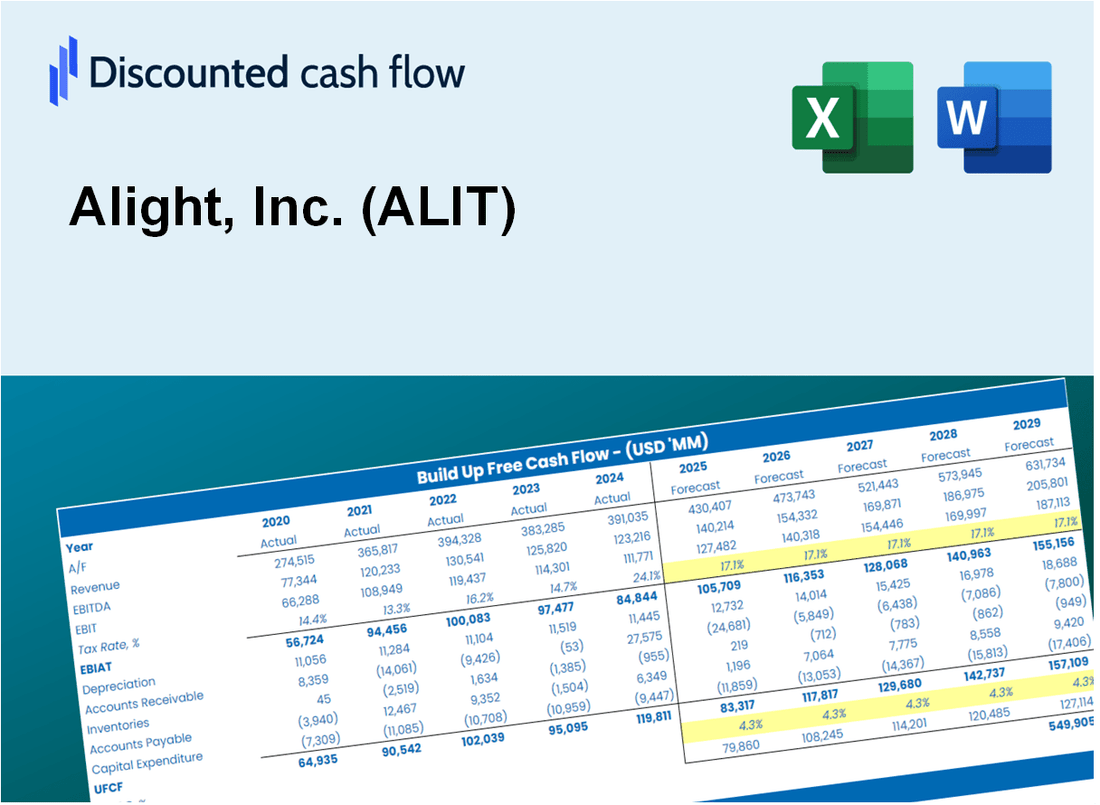
Alight, Inc. (ALIT) Bundle
Projetado para precisão, nossa calculadora DCF (ALIT) permite avaliar a avaliação da ALGED, Inc. usando dados financeiros do mundo real, oferecendo flexibilidade completa para modificar todos os parâmetros essenciais para melhorar as projeções.
Discounted Cash Flow (DCF) - (USD MM)
| Year | AY1 2020 |
AY2 2021 |
AY3 2022 |
AY4 2023 |
AY5 2024 |
FY1 2025 |
FY2 2026 |
FY3 2027 |
FY4 2028 |
FY5 2029 |
|---|---|---|---|---|---|---|---|---|---|---|
| Revenue | 2,728.0 | 2,915.0 | 3,132.0 | 3,410.0 | 2,332.0 | 2,282.8 | 2,234.7 | 2,187.5 | 2,141.4 | 2,096.2 |
| Revenue Growth, % | 0 | 6.85 | 7.44 | 8.88 | -31.61 | -2.11 | -2.11 | -2.11 | -2.11 | -2.11 |
| EBITDA | 431.0 | 481.0 | 476.0 | 186.0 | 350.0 | 310.3 | 303.7 | 297.3 | 291.1 | 284.9 |
| EBITDA, % | 15.8 | 16.5 | 15.2 | 5.45 | 15.01 | 13.59 | 13.59 | 13.59 | 13.59 | 13.59 |
| Depreciation | 291.0 | 354.0 | 395.0 | 421.0 | 395.0 | 295.4 | 289.2 | 283.1 | 277.1 | 271.3 |
| Depreciation, % | 10.67 | 12.14 | 12.61 | 12.35 | 16.94 | 12.94 | 12.94 | 12.94 | 12.94 | 12.94 |
| EBIT | 140.0 | 127.0 | 81.0 | -235.0 | -45.0 | 14.9 | 14.5 | 14.2 | 13.9 | 13.6 |
| EBIT, % | 5.13 | 4.36 | 2.59 | -6.89 | -1.93 | 0.65076 | 0.65076 | 0.65076 | 0.65076 | 0.65076 |
| Total Cash | 506.0 | 372.0 | 250.0 | 358.0 | 343.0 | 294.5 | 288.3 | 282.2 | 276.2 | 270.4 |
| Total Cash, percent | .0 | .0 | .0 | .0 | .0 | .0 | .0 | .0 | .0 | .0 |
| Account Receivables | 564.0 | 663.0 | 827.0 | 805.0 | 560.0 | 536.2 | 524.9 | 513.8 | 503.0 | 492.4 |
| Account Receivables, % | 20.67 | 22.74 | 26.4 | 23.61 | 24.01 | 23.49 | 23.49 | 23.49 | 23.49 | 23.49 |
| Inventories | .0 | .0 | .0 | .0 | .0 | .0 | .0 | .0 | .0 | .0 |
| Inventories, % | 0 | 0 | 0 | 0 | 0 | 0 | 0 | 0 | 0 | 0 |
| Accounts Payable | 394.0 | 406.0 | 508.0 | 444.0 | 355.0 | 332.5 | 325.5 | 318.7 | 311.9 | 305.3 |
| Accounts Payable, % | 14.44 | 13.93 | 16.22 | 13.02 | 15.22 | 14.57 | 14.57 | 14.57 | 14.57 | 14.57 |
| Capital Expenditure | -90.0 | -114.0 | -148.0 | -160.0 | -121.0 | -99.6 | -97.5 | -95.4 | -93.4 | -91.5 |
| Capital Expenditure, % | -3.3 | -3.91 | -4.73 | -4.69 | -5.19 | -4.36 | -4.36 | -4.36 | -4.36 | -4.36 |
| Tax Rate, % | -6.08 | -6.08 | -6.08 | -6.08 | -6.08 | -6.08 | -6.08 | -6.08 | -6.08 | -6.08 |
| EBITAT | 153.4 | 143.8 | 122.5 | -221.5 | -47.7 | 14.7 | 14.4 | 14.1 | 13.8 | 13.5 |
| Depreciation | ||||||||||
| Changes in Account Receivables | ||||||||||
| Changes in Inventories | ||||||||||
| Changes in Accounts Payable | ||||||||||
| Capital Expenditure | ||||||||||
| UFCF | 184.4 | 296.8 | 307.5 | -2.5 | 382.3 | 211.8 | 210.4 | 205.9 | 201.6 | 197.3 |
| WACC, % | 6.32 | 6.32 | 6.32 | 6.15 | 6.32 | 6.29 | 6.29 | 6.29 | 6.29 | 6.29 |
| PV UFCF | ||||||||||
| SUM PV UFCF | 860.4 | |||||||||
| Long Term Growth Rate, % | 2.00 | |||||||||
| Free cash flow (T + 1) | 201 | |||||||||
| Terminal Value | 4,694 | |||||||||
| Present Terminal Value | 3,460 | |||||||||
| Enterprise Value | 4,321 | |||||||||
| Net Debt | 1,813 | |||||||||
| Equity Value | 2,508 | |||||||||
| Diluted Shares Outstanding, MM | 547 | |||||||||
| Equity Value Per Share | 4.58 |
What You Will Get
- Editable Forecast Inputs: Easily modify assumptions (growth %, margins, WACC) to generate various scenarios.
- Real-World Data: Alight, Inc.’s (ALIT) financial data pre-filled to kickstart your analysis.
- Automatic DCF Outputs: The template computes Net Present Value (NPV) and intrinsic value for you.
- Customizable and Professional: A sleek Excel model that adjusts to your valuation requirements.
- Built for Analysts and Investors: Perfect for testing projections, validating strategies, and optimizing your time.
Key Features
- 🔍 Real-Life ALIT Financials: Pre-filled historical and projected data for Alight, Inc.
- ✏️ Fully Customizable Inputs: Adjust all critical parameters (yellow cells) like WACC, growth %, and tax rates.
- 📊 Professional DCF Valuation: Built-in formulas calculate Alight’s intrinsic value using the Discounted Cash Flow method.
- ⚡ Instant Results: Visualize Alight’s valuation instantly after making changes.
- Scenario Analysis: Test and compare outcomes for various financial assumptions side-by-side.
How It Works
- 1. Access the Model: Download and open the Excel file containing Alight, Inc.'s (ALIT) financial data.
- 2. Customize Inputs: Adjust key parameters such as growth projections, WACC, and capital expenditures.
- 3. Analyze Results in Real-Time: The DCF model automatically computes intrinsic value and NPV based on your inputs.
- 4. Explore Various Scenarios: Evaluate different forecasts to understand a range of valuation possibilities.
- 5. Present with Assurance: Deliver expert valuation findings to enhance your strategic decisions.
Why Choose This Calculator for Alight, Inc. (ALIT)?
- Accurate Data: Utilize real Alight financials for dependable valuation outcomes.
- Customizable: Modify essential parameters such as growth rates, WACC, and tax rates to align with your forecasts.
- Time-Saving: Pre-configured calculations save you from starting from the ground up.
- Professional-Grade Tool: Tailored for investors, analysts, and consultants in the field.
- User-Friendly: Designed with an intuitive interface and clear instructions for users of all levels.
Who Should Use This Product?
- Professional Investors: Develop comprehensive and trustworthy valuation models for portfolio assessments of Alight, Inc. (ALIT).
- Corporate Finance Teams: Evaluate valuation scenarios to inform strategic decisions within the organization.
- Consultants and Advisors: Deliver precise valuation insights to clients regarding Alight, Inc. (ALIT) stock.
- Students and Educators: Utilize real-time data to enhance learning and practice in financial modeling.
- Tech Enthusiasts: Gain insights into how technology firms like Alight, Inc. (ALIT) are appraised in the marketplace.
What the Alight, Inc. (ALIT) Template Contains
- Comprehensive DCF Model: Editable template featuring in-depth valuation calculations.
- Real-World Data: Alight, Inc.'s historical and projected financials preloaded for thorough analysis.
- Customizable Parameters: Modify WACC, growth rates, and tax assumptions to explore different scenarios.
- Financial Statements: Complete annual and quarterly breakdowns for enhanced insights.
- Key Ratios: Integrated analysis for profitability, efficiency, and leverage metrics.
- Dashboard with Visual Outputs: Visualizations and tables for clear, actionable results.
Disclaimer
All information, articles, and product details provided on this website are for general informational and educational purposes only. We do not claim any ownership over, nor do we intend to infringe upon, any trademarks, copyrights, logos, brand names, or other intellectual property mentioned or depicted on this site. Such intellectual property remains the property of its respective owners, and any references here are made solely for identification or informational purposes, without implying any affiliation, endorsement, or partnership.
We make no representations or warranties, express or implied, regarding the accuracy, completeness, or suitability of any content or products presented. Nothing on this website should be construed as legal, tax, investment, financial, medical, or other professional advice. In addition, no part of this site—including articles or product references—constitutes a solicitation, recommendation, endorsement, advertisement, or offer to buy or sell any securities, franchises, or other financial instruments, particularly in jurisdictions where such activity would be unlawful.
All content is of a general nature and may not address the specific circumstances of any individual or entity. It is not a substitute for professional advice or services. Any actions you take based on the information provided here are strictly at your own risk. You accept full responsibility for any decisions or outcomes arising from your use of this website and agree to release us from any liability in connection with your use of, or reliance upon, the content or products found herein.