
|
AllFunds Group plc (allfg.as) DCF Avaliação |
Totalmente Editável: Adapte-Se Às Suas Necessidades No Excel Ou Planilhas
Design Profissional: Modelos Confiáveis E Padrão Da Indústria
Pré-Construídos Para Uso Rápido E Eficiente
Compatível com MAC/PC, totalmente desbloqueado
Não É Necessária Experiência; Fácil De Seguir
Allfunds Group plc (ALLFG.AS) Bundle
Procurando avaliar o valor intrínseco do AllFunds Group plc? Nossa calculadora DCF (AllFGAS) integra dados do mundo real com recursos abrangentes de personalização, permitindo ajustar as previsões e aprimorar suas opções de investimento.
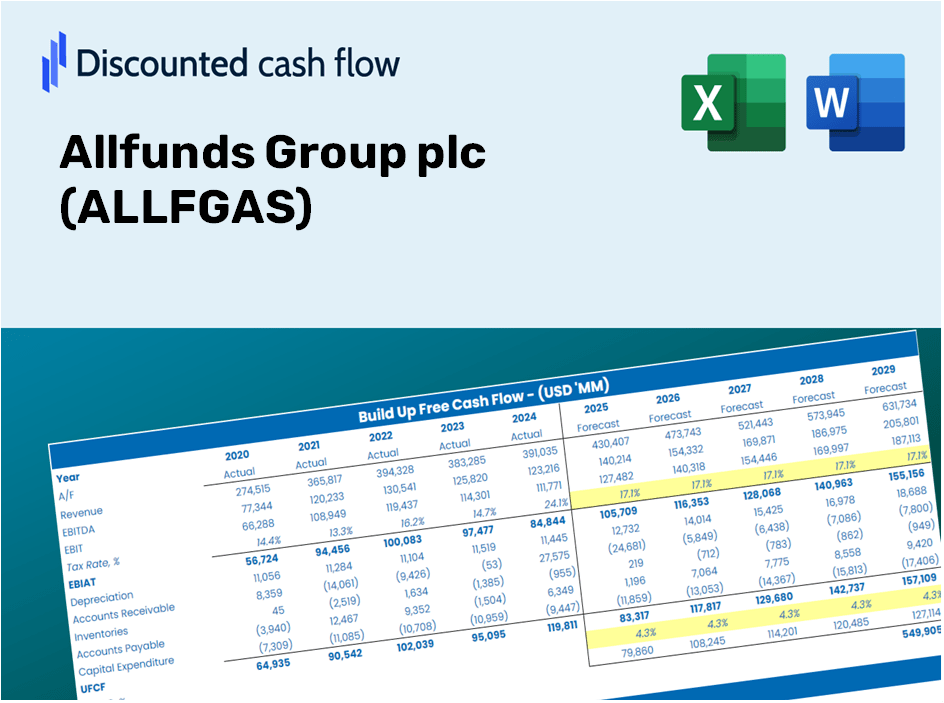
Discounted Cash Flow (DCF) - (USD MM)
| Year | AY1 2020 |
AY2 2021 |
AY3 2022 |
AY4 2023 |
AY5 2024 |
FY1 2025 |
FY2 2026 |
FY3 2027 |
FY4 2028 |
FY5 2029 |
|---|---|---|---|---|---|---|---|---|---|---|
| Revenue | 1,589.4 | 2,668.9 | 2,742.0 | 491.9 | 555.5 | 557.7 | 559.8 | 562.0 | 564.2 | 566.3 |
| Revenue Growth, % | 0 | 67.92 | 2.74 | -82.06 | 12.94 | 0.38594 | 0.38594 | 0.38594 | 0.38594 | 0.38594 |
| EBITDA | 152.5 | 256.0 | 276.7 | 315.0 | 136.2 | 131.4 | 131.9 | 132.4 | 133.0 | 133.5 |
| EBITDA, % | 9.59 | 9.59 | 10.09 | 64.05 | 24.51 | 23.57 | 23.57 | 23.57 | 23.57 | 23.57 |
| Depreciation | 130.0 | 161.8 | 171.1 | 148.0 | 180.5 | 92.6 | 93.0 | 93.4 | 93.7 | 94.1 |
| Depreciation, % | 8.18 | 6.06 | 6.24 | 30.09 | 32.49 | 16.61 | 16.61 | 16.61 | 16.61 | 16.61 |
| EBIT | 22.4 | 94.2 | 105.6 | 167.0 | -44.3 | 38.8 | 38.9 | 39.1 | 39.2 | 39.4 |
| EBIT, % | 1.41 | 3.53 | 3.85 | 33.96 | -7.98 | 6.95 | 6.95 | 6.95 | 6.95 | 6.95 |
| Total Cash | 2,075.6 | 2,254.7 | 1,785.3 | 2,269.3 | 2,743.6 | 501.5 | 503.4 | 505.3 | 507.3 | 509.2 |
| Total Cash, percent | .0 | .0 | .0 | .0 | .0 | .0 | .0 | .0 | .0 | .0 |
| Account Receivables | 178.9 | 192.8 | 301.4 | 800.3 | 249.9 | 194.6 | 195.3 | 196.1 | 196.8 | 197.6 |
| Account Receivables, % | 11.26 | 7.22 | 10.99 | 162.7 | 44.98 | 34.89 | 34.89 | 34.89 | 34.89 | 34.89 |
| Inventories | -.5 | -.4 | -.3 | -12.8 | .0 | -3.0 | -3.0 | -3.0 | -3.0 | -3.0 |
| Inventories, % | -0.03189957 | -0.01412573 | -0.01247259 | -2.6 | 0 | -0.53244 | -0.53244 | -0.53244 | -0.53244 | -0.53244 |
| Accounts Payable | 18.7 | 24.1 | 12.6 | 10.2 | 17.2 | 8.6 | 8.6 | 8.7 | 8.7 | 8.7 |
| Accounts Payable, % | 1.18 | 0.90337 | 0.45842 | 2.07 | 3.09 | 1.54 | 1.54 | 1.54 | 1.54 | 1.54 |
| Capital Expenditure | -28.5 | -23.5 | -39.7 | -79.7 | -109.0 | -44.5 | -44.7 | -44.9 | -45.1 | -45.2 |
| Capital Expenditure, % | -1.79 | -0.88089 | -1.45 | -16.19 | -19.62 | -7.99 | -7.99 | -7.99 | -7.99 | -7.99 |
| Tax Rate, % | -138.16 | -138.16 | -138.16 | -138.16 | -138.16 | -138.16 | -138.16 | -138.16 | -138.16 | -138.16 |
| EBITAT | -.1 | 134.7 | 62.0 | 93.8 | -105.6 | 24.4 | 24.5 | 24.6 | 24.7 | 24.8 |
| Depreciation | ||||||||||
| Changes in Account Receivables | ||||||||||
| Changes in Inventories | ||||||||||
| Changes in Accounts Payable | ||||||||||
| Capital Expenditure | ||||||||||
| UFCF | -58.2 | 264.5 | 73.1 | -326.6 | 510.5 | 122.2 | 72.1 | 72.4 | 72.7 | 72.9 |
| WACC, % | 5.37 | 6.89 | 6.26 | 6.22 | 6.89 | 6.33 | 6.33 | 6.33 | 6.33 | 6.33 |
| PV UFCF | ||||||||||
| SUM PV UFCF | 349.5 | |||||||||
| Long Term Growth Rate, % | 2.00 | |||||||||
| Free cash flow (T + 1) | 74 | |||||||||
| Terminal Value | 1,720 | |||||||||
| Present Terminal Value | 1,265 | |||||||||
| Enterprise Value | 1,615 | |||||||||
| Net Debt | -8 | |||||||||
| Equity Value | 1,623 | |||||||||
| Diluted Shares Outstanding, MM | 610 | |||||||||
| Equity Value Per Share | 2.66 |
What You Will Receive
- Comprehensive ALLFG Financial Data: Pre-loaded with Allfunds Group plc’s (ALLFGAS) historical and forecasted data for accurate analysis.
- Customizable Template: Easily adjust key metrics such as revenue growth, WACC, and EBITDA percentage.
- Instant Calculations: Observe real-time updates to Allfunds Group plc’s (ALLFGAS) intrinsic value as you modify inputs.
- Professional Valuation Resource: Tailored for investors, analysts, and consultants aiming for precise DCF outcomes.
- Intuitive Design: Clear layout and straightforward guidelines suitable for users of all experience levels.
Key Features
- Comprehensive Financial Data: Gain access to precise pre-loaded historical metrics and future forecasts for Allfunds Group plc (ALLFGAS).
- Adjustable Forecast Parameters: Modify the highlighted cells for key metrics like WACC, growth rates, and profit margins.
- Real-Time Calculations: Enjoy automatic updates for DCF, Net Present Value (NPV), and cash flow assessments.
- User-Friendly Dashboard: View straightforward charts and summaries that make understanding your valuation results effortless.
- Designed for All Skill Levels: An intuitive layout tailored for investors, CFOs, and consultants, whether you're a novice or a seasoned professional.
How It Operates
- Step 1: Download the Excel file.
- Step 2: Examine the pre-populated Allfunds Group plc (ALLFGAS) data (historical and projected).
- Step 3: Modify key assumptions (yellow cells) according to your findings.
- Step 4: Observe automatic updates for Allfunds Group plc (ALLFGAS)'s intrinsic value.
- Step 5: Utilize the results for investment decisions or reporting purposes.
Why Choose This Calculator for Allfunds Group plc (ALLFGAS)?
- All-in-One Solution: Offers DCF, WACC, and various financial ratio evaluations all in one tool.
- Flexible Inputs: Modify the yellow-highlighted fields to explore different financial scenarios.
- In-Depth Analysis: Automatically computes the intrinsic value and Net Present Value for Allfunds Group plc.
- Data Ready: Comes with historical and projected data to provide reliable baseline figures.
- High-Quality Standards: Perfect for financial analysts, investors, and business advisors.
Who Can Benefit from This Product?
- Investors: Assess Allfunds Group plc's ((ALLFGAS)) valuation before making investment decisions.
- CFOs and Financial Analysts: Optimize valuation workflows and evaluate financial projections.
- Startup Founders: Discover how established companies like Allfunds Group plc are valued in the market.
- Consultants: Provide comprehensive valuation reports to your clients.
- Students and Educators: Utilize real data to enhance learning and practice valuation methodologies.
What the Template Includes
- Operating and Balance Sheet Data: Pre-filled historical data and forecasts for Allfunds Group plc (ALLFGAS), encompassing revenue, EBITDA, EBIT, and capital expenditures.
- WACC Calculation: A specific sheet for calculating the Weighted Average Cost of Capital (WACC), featuring parameters such as Beta, risk-free rate, and share price.
- DCF Valuation (Unlevered and Levered): Customizable Discounted Cash Flow models illustrating intrinsic value with comprehensive calculations.
- Financial Statements: Pre-loaded annual and quarterly financial statements to facilitate thorough analysis.
- Key Ratios: Includes a set of profitability, leverage, and efficiency ratios pertinent to Allfunds Group plc (ALLFGAS).
- Dashboard and Charts: A visual summary of valuation outputs and assumptions, designed for easy analysis of results.
Disclaimer
All information, articles, and product details provided on this website are for general informational and educational purposes only. We do not claim any ownership over, nor do we intend to infringe upon, any trademarks, copyrights, logos, brand names, or other intellectual property mentioned or depicted on this site. Such intellectual property remains the property of its respective owners, and any references here are made solely for identification or informational purposes, without implying any affiliation, endorsement, or partnership.
We make no representations or warranties, express or implied, regarding the accuracy, completeness, or suitability of any content or products presented. Nothing on this website should be construed as legal, tax, investment, financial, medical, or other professional advice. In addition, no part of this site—including articles or product references—constitutes a solicitation, recommendation, endorsement, advertisement, or offer to buy or sell any securities, franchises, or other financial instruments, particularly in jurisdictions where such activity would be unlawful.
All content is of a general nature and may not address the specific circumstances of any individual or entity. It is not a substitute for professional advice or services. Any actions you take based on the information provided here are strictly at your own risk. You accept full responsibility for any decisions or outcomes arising from your use of this website and agree to release us from any liability in connection with your use of, or reliance upon, the content or products found herein.