
|
ALOK INDUSTRIES LIMITED (ALOKINDS.NS) Avaliação DCF |
Totalmente Editável: Adapte-Se Às Suas Necessidades No Excel Ou Planilhas
Design Profissional: Modelos Confiáveis E Padrão Da Indústria
Pré-Construídos Para Uso Rápido E Eficiente
Compatível com MAC/PC, totalmente desbloqueado
Não É Necessária Experiência; Fácil De Seguir
Alok Industries Limited (ALOKINDS.NS) Bundle
Aprimore sua estratégia de investimento com a calculadora DCF (Alokindsns)! Mergulhe nos dados financeiros reais da Alok Industries Limited, ajuste as projeções e despesas de crescimento e observe como essas modificações afetam o valor intrínseco de (Alokindsns) em tempo real.
Discounted Cash Flow (DCF) - (USD MM)
| Year | AY1 2021 |
AY2 2022 |
AY3 2023 |
AY4 2024 |
AY5 2025 |
FY1 2026 |
FY2 2027 |
FY3 2028 |
FY4 2029 |
FY5 2030 |
|---|---|---|---|---|---|---|---|---|---|---|
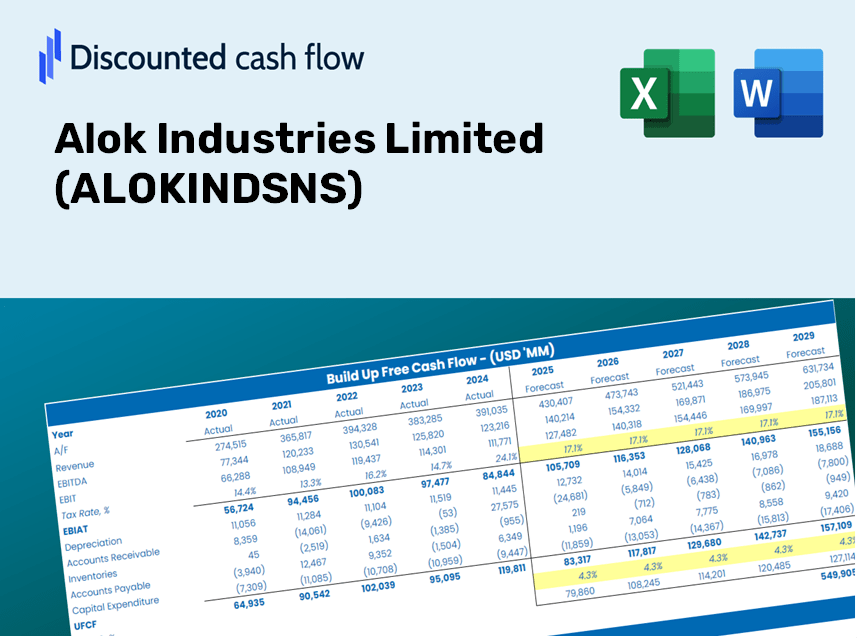
| Revenue | 37,841.1 | 73,095.0 | 69,008.7 | 55,095.9 | 37,087.8 | 40,307.6 | 43,807.0 | 47,610.2 | 51,743.5 | 56,235.7 |
| Revenue Growth, % | 0 | 93.16 | -5.59 | -20.16 | -32.69 | 8.68 | 8.68 | 8.68 | 8.68 | 8.68 |
| EBITDA | -36,695.1 | 6,092.3 | -372.6 | -265.2 | 1,158.2 | -6,976.1 | -7,581.7 | -8,239.9 | -8,955.3 | -9,732.7 |
| EBITDA, % | -96.97 | 8.33 | -0.53993 | -0.48134 | 3.12 | -17.31 | -17.31 | -17.31 | -17.31 | -17.31 |
| Depreciation | 2,943.9 | 3,421.6 | 3,649.1 | 3,239.3 | 2,981.0 | 2,552.7 | 2,774.4 | 3,015.2 | 3,277.0 | 3,561.5 |
| Depreciation, % | 7.78 | 4.68 | 5.29 | 5.88 | 8.04 | 6.33 | 6.33 | 6.33 | 6.33 | 6.33 |
| EBIT | -39,639.0 | 2,670.7 | -4,021.7 | -3,504.5 | -1,822.8 | -9,145.8 | -9,939.8 | -10,802.7 | -11,740.6 | -12,759.8 |
| EBIT, % | -104.75 | 3.65 | -5.83 | -6.36 | -4.91 | -22.69 | -22.69 | -22.69 | -22.69 | -22.69 |
| Total Cash | 1,936.5 | 169.5 | 138.6 | 191.2 | 715.1 | 630.8 | 685.6 | 745.1 | 809.8 | 880.1 |
| Total Cash, percent | .0 | .0 | .0 | .0 | .0 | .0 | .0 | .0 | .0 | .0 |
| Account Receivables | 3,497.5 | 5,053.2 | 3,565.1 | 4,647.3 | 4,395.2 | 3,354.2 | 3,645.4 | 3,961.9 | 4,305.9 | 4,679.7 |
| Account Receivables, % | 9.24 | 6.91 | 5.17 | 8.43 | 11.85 | 8.32 | 8.32 | 8.32 | 8.32 | 8.32 |
| Inventories | 9,643.7 | 12,844.2 | 10,390.3 | 9,415.7 | 8,663.3 | 7,945.6 | 8,635.4 | 9,385.1 | 10,199.9 | 11,085.4 |
| Inventories, % | 25.48 | 17.57 | 15.06 | 17.09 | 23.36 | 19.71 | 19.71 | 19.71 | 19.71 | 19.71 |
| Accounts Payable | 10,951.1 | 13,257.4 | 16,252.6 | 4,886.6 | 4,110.1 | 7,302.1 | 7,936.1 | 8,625.0 | 9,373.8 | 10,187.6 |
| Accounts Payable, % | 28.94 | 18.14 | 23.55 | 8.87 | 11.08 | 18.12 | 18.12 | 18.12 | 18.12 | 18.12 |
| Capital Expenditure | -2,272.5 | -1,069.9 | -442.2 | -361.5 | -793.7 | -879.2 | -955.5 | -1,038.5 | -1,128.6 | -1,226.6 |
| Capital Expenditure, % | -6.01 | -1.46 | -0.64079 | -0.65613 | -2.14 | -2.18 | -2.18 | -2.18 | -2.18 | -2.18 |
| Tax Rate, % | -0.61868 | -0.61868 | -0.61868 | -0.61868 | -0.61868 | -0.61868 | -0.61868 | -0.61868 | -0.61868 | -0.61868 |
| EBITAT | -50,487.9 | 2,660.2 | -4,024.0 | -3,492.5 | -1,834.1 | -9,132.3 | -9,925.2 | -10,786.8 | -11,723.3 | -12,741.1 |
| Depreciation | ||||||||||
| Changes in Account Receivables | ||||||||||
| Changes in Inventories | ||||||||||
| Changes in Accounts Payable | ||||||||||
| Capital Expenditure | ||||||||||
| UFCF | -52,006.6 | 2,562.0 | 6,120.1 | -12,088.3 | 581.2 | -2,508.1 | -8,453.4 | -9,187.3 | -9,984.9 | -10,851.8 |
| WACC, % | 3.98 | 3.96 | 3.98 | 3.97 | 3.98 | 3.97 | 3.97 | 3.97 | 3.97 | 3.97 |
| PV UFCF | ||||||||||
| SUM PV UFCF | -35,883.0 | |||||||||
| Long Term Growth Rate, % | 2.00 | |||||||||
| Free cash flow (T + 1) | -11,069 | |||||||||
| Terminal Value | -561,579 | |||||||||
| Present Terminal Value | -462,221 | |||||||||
| Enterprise Value | -498,104 | |||||||||
| Net Debt | 259,381 | |||||||||
| Equity Value | -757,485 | |||||||||
| Diluted Shares Outstanding, MM | 4,978 | |||||||||
| Equity Value Per Share | -152.16 |
What You Will Receive
- Real ALOKINDS Financial Data: Pre-populated with Alok Industries Limited’s historical and projected data for accurate analysis.
- Fully Customizable Template: Easily adjust key inputs such as revenue growth, WACC, and EBITDA percentage.
- Instantaneous Calculations: Watch Alok Industries Limited’s intrinsic value update in real-time based on your modifications.
- Professional Valuation Tool: Tailored for investors, analysts, and consultants who seek precise DCF results.
- User-Friendly Interface: Designed with a clear structure and straightforward instructions suitable for all skill levels.
Key Features
- Pre-Loaded Data: Historical financial statements and pre-filled forecasts for Alok Industries Limited (ALOKINDSNS).
- Fully Adjustable Inputs: Modify WACC, tax rates, revenue growth, and EBITDA margins according to your preferences.
- Instant Results: Watch Alok Industries Limited's (ALOKINDSNS) intrinsic value update in real time.
- Clear Visual Outputs: Visualize valuation results and key metrics through comprehensive dashboard charts.
- Built for Accuracy: A reliable tool designed for analysts, investors, and finance professionals.
How It Works
- Step 1: Download the prebuilt Excel template featuring Alok Industries Limited's (ALOKINDSNS) data.
- Step 2: Review the pre-filled sheets to familiarize yourself with the key metrics.
- Step 3: Adjust forecasts and assumptions in the editable yellow cells (WACC, growth, margins).
- Step 4: Instantly see the recalculated results, including Alok Industries Limited's (ALOKINDSNS) intrinsic value.
- Step 5: Utilize the outputs to make informed investment decisions or create reports.
Why Choose Our Calculator?
- Time-Efficient: Skip the hassle of building a DCF model from the ground up – it’s ready for immediate use.
- Enhanced Precision: Dependable financial data and established formulas minimize valuation errors.
- Completely Customizable: Adjust the model to align with your unique assumptions and forecasts.
- User-Friendly: Intuitive charts and outputs simplify the analysis of results.
- Backed by Professionals: Crafted for industry experts who prioritize accuracy and ease of use.
Who is This Product Ideal For?
- Investors: Effectively assess the fair value of Alok Industries Limited (ALOKINDSNS) prior to making investment choices.
- Financial Officers: Utilize a high-quality DCF model for comprehensive financial reporting and analysis.
- Consultants: Seamlessly customize the template for client valuation reports.
- Entrepreneurs: Acquire knowledge of financial modeling techniques employed by leading corporations.
- Educators: Employ it as an instructional resource to illustrate various valuation methods.
Contents of the Template
- Operating and Balance Sheet Data: Pre-filled historical data and forecasts for Alok Industries Limited (ALOKINDSNS), including revenue, EBITDA, EBIT, and capital expenditures.
- WACC Calculation: A dedicated sheet for calculating the Weighted Average Cost of Capital (WACC), featuring parameters such as Beta, risk-free rate, and share price.
- DCF Valuation (Unlevered and Levered): Customizable Discounted Cash Flow models that detail intrinsic value along with comprehensive calculations.
- Financial Statements: Pre-loaded annual and quarterly financial statements to facilitate thorough analysis.
- Key Ratios: A collection of profitability, leverage, and efficiency ratios specific to Alok Industries Limited (ALOKINDSNS).
- Dashboard and Charts: A visual overview of valuation outputs and underlying assumptions for easy result analysis.
Disclaimer
All information, articles, and product details provided on this website are for general informational and educational purposes only. We do not claim any ownership over, nor do we intend to infringe upon, any trademarks, copyrights, logos, brand names, or other intellectual property mentioned or depicted on this site. Such intellectual property remains the property of its respective owners, and any references here are made solely for identification or informational purposes, without implying any affiliation, endorsement, or partnership.
We make no representations or warranties, express or implied, regarding the accuracy, completeness, or suitability of any content or products presented. Nothing on this website should be construed as legal, tax, investment, financial, medical, or other professional advice. In addition, no part of this site—including articles or product references—constitutes a solicitation, recommendation, endorsement, advertisement, or offer to buy or sell any securities, franchises, or other financial instruments, particularly in jurisdictions where such activity would be unlawful.
All content is of a general nature and may not address the specific circumstances of any individual or entity. It is not a substitute for professional advice or services. Any actions you take based on the information provided here are strictly at your own risk. You accept full responsibility for any decisions or outcomes arising from your use of this website and agree to release us from any liability in connection with your use of, or reliance upon, the content or products found herein.