
|
Avaliação DCF da Amarin Corporation plc (AMRN) |
Totalmente Editável: Adapte-Se Às Suas Necessidades No Excel Ou Planilhas
Design Profissional: Modelos Confiáveis E Padrão Da Indústria
Pré-Construídos Para Uso Rápido E Eficiente
Compatível com MAC/PC, totalmente desbloqueado
Não É Necessária Experiência; Fácil De Seguir
Amarin Corporation plc (AMRN) Bundle
Explore as perspectivas financeiras da Amarin Corporation PLC (AMRN) com nossa calculadora DCF! Basta inserir suas projeções de crescimento, margens e despesas para calcular o valor intrínseco de Amarin (AMRN) e aprimorar sua abordagem de investimento.
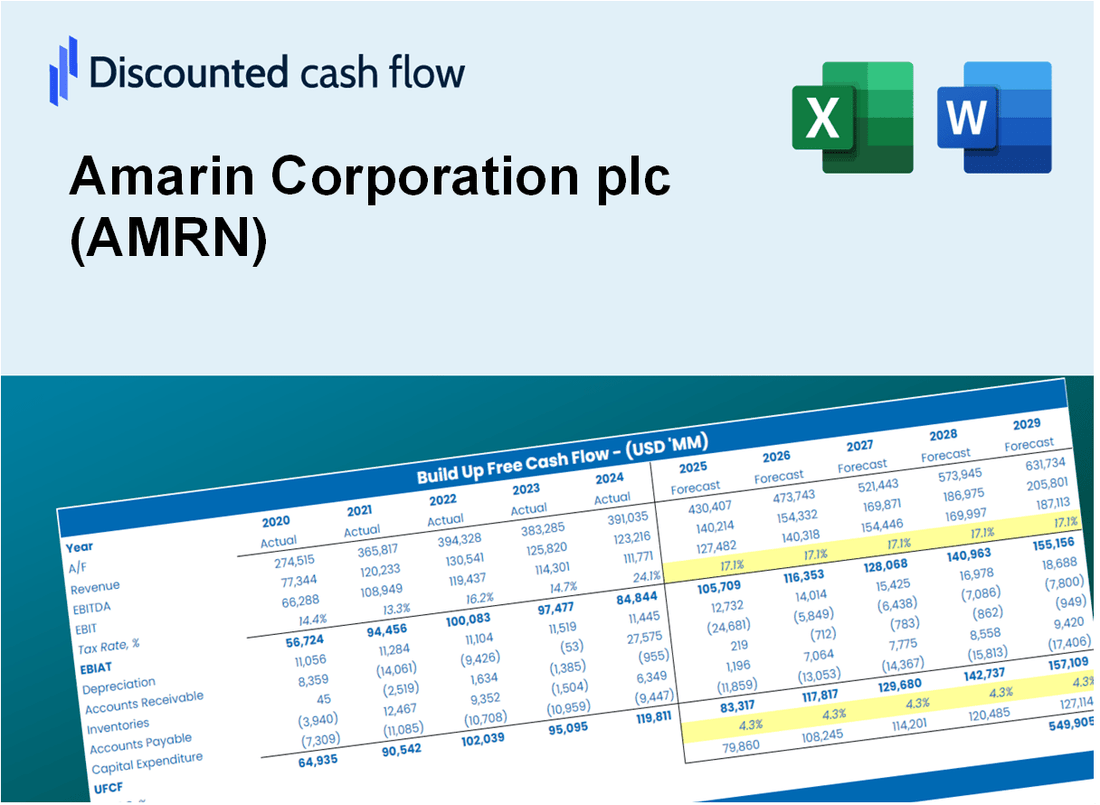
Discounted Cash Flow (DCF) - (USD MM)
| Year | AY1 2020 |
AY2 2021 |
AY3 2022 |
AY4 2023 |
AY5 2024 |
FY1 2025 |
FY2 2026 |
FY3 2027 |
FY4 2028 |
FY5 2029 |
|---|---|---|---|---|---|---|---|---|---|---|
| Revenue | 614.1 | 583.2 | 369.2 | 306.9 | 228.6 | 180.5 | 142.6 | 112.6 | 88.9 | 70.2 |
| Revenue Growth, % | 0 | -5.03 | -36.69 | -16.87 | -25.51 | -21.03 | -21.03 | -21.03 | -21.03 | -21.03 |
| EBITDA | -12.7 | 14.3 | -100.6 | -50.7 | -74.2 | -27.4 | -21.6 | -17.1 | -13.5 | -10.7 |
| EBITDA, % | -2.07 | 2.45 | -27.26 | -16.52 | -32.45 | -15.17 | -15.17 | -15.17 | -15.17 | -15.17 |
| Depreciation | 2.1 | 2.9 | 3.1 | 3.0 | 3.0 | 1.4 | 1.1 | .9 | .7 | .6 |
| Depreciation, % | 0.3345 | 0.48989 | 0.83804 | 0.96608 | 1.32 | 0.78938 | 0.78938 | 0.78938 | 0.78938 | 0.78938 |
| EBIT | -14.8 | 11.4 | -103.7 | -53.7 | -77.2 | -28.8 | -22.8 | -18.0 | -14.2 | -11.2 |
| EBIT, % | -2.4 | 1.96 | -28.1 | -17.48 | -33.77 | -15.96 | -15.96 | -15.96 | -15.96 | -15.96 |
| Total Cash | 500.9 | 454.1 | 309.4 | 320.7 | 294.2 | 160.1 | 126.4 | 99.8 | 78.8 | 62.3 |
| Total Cash, percent | .0 | .0 | .0 | .0 | .0 | .0 | .0 | .0 | .0 | .0 |
| Account Receivables | 154.6 | 163.7 | 131.0 | 133.6 | 122.3 | 67.1 | 53.0 | 41.8 | 33.0 | 26.1 |
| Account Receivables, % | 25.17 | 28.06 | 35.48 | 43.52 | 53.49 | 37.14 | 37.14 | 37.14 | 37.14 | 37.14 |
| Inventories | 188.9 | 234.7 | 228.7 | 258.6 | 166.0 | 104.7 | 82.7 | 65.3 | 51.6 | 40.7 |
| Inventories, % | 30.76 | 40.24 | 61.95 | 84.26 | 72.63 | 57.97 | 57.97 | 57.97 | 57.97 | 57.97 |
| Accounts Payable | 105.9 | 114.9 | 64.6 | 52.8 | 40.4 | 32.2 | 25.5 | 20.1 | 15.9 | 12.5 |
| Accounts Payable, % | 17.24 | 19.71 | 17.5 | 17.19 | 17.66 | 17.86 | 17.86 | 17.86 | 17.86 | 17.86 |
| Capital Expenditure | -.3 | .0 | -.6 | -.5 | .0 | -.1 | -.1 | -.1 | -.1 | -.1 |
| Capital Expenditure, % | -0.04103834 | -0.000685804625 | -0.16225 | -0.17367 | 0 | -0.07552718 | -0.07552718 | -0.07552718 | -0.07552718 | -0.07552718 |
| Tax Rate, % | -6.45 | -6.45 | -6.45 | -6.45 | -6.45 | -6.45 | -6.45 | -6.45 | -6.45 | -6.45 |
| EBITAT | -15.4 | 7.8 | -105.7 | -59.1 | -82.2 | -27.0 | -21.3 | -16.8 | -13.3 | -10.5 |
| Depreciation | ||||||||||
| Changes in Account Receivables | ||||||||||
| Changes in Inventories | ||||||||||
| Changes in Accounts Payable | ||||||||||
| Capital Expenditure | ||||||||||
| UFCF | -251.2 | -35.2 | -115.0 | -101.0 | 12.3 | 82.8 | 9.0 | 7.1 | 5.6 | 4.4 |
| WACC, % | 7.11 | 7.11 | 7.11 | 7.11 | 7.11 | 7.11 | 7.11 | 7.11 | 7.11 | 7.11 |
| PV UFCF | ||||||||||
| SUM PV UFCF | 98.4 | |||||||||
| Long Term Growth Rate, % | 2.00 | |||||||||
| Free cash flow (T + 1) | 5 | |||||||||
| Terminal Value | 89 | |||||||||
| Present Terminal Value | 63 | |||||||||
| Enterprise Value | 161 | |||||||||
| Net Debt | -113 | |||||||||
| Equity Value | 275 | |||||||||
| Diluted Shares Outstanding, MM | 411 | |||||||||
| Equity Value Per Share | 0.67 |
What You Will Get
- Editable Excel Template: A fully customizable Excel-based DCF Calculator featuring pre-filled real AMRN financials.
- Real-World Data: Historical data and forward-looking estimates (highlighted in the yellow cells).
- Forecast Flexibility: Adjust forecast assumptions such as revenue growth, EBITDA %, and WACC.
- Automatic Calculations: Instantly observe how your inputs affect Amarin’s valuation.
- Professional Tool: Designed for investors, CFOs, consultants, and financial analysts.
- User-Friendly Design: Organized for clarity and ease of use, complete with step-by-step instructions.
Key Features
- Accurate Financial Data: Gain access to reliable pre-loaded historical data and future forecasts for Amarin Corporation plc (AMRN).
- Adjustable Forecast Parameters: Modify highlighted cells such as WACC, growth rates, and profit margins to suit your analysis.
- Real-Time Calculations: Enjoy automatic updates for DCF, Net Present Value (NPV), and cash flow assessments.
- Interactive Dashboard: Utilize user-friendly charts and summaries to clearly present your valuation findings.
- Designed for All Skill Levels: A straightforward, intuitive layout tailored for investors, CFOs, and consultants alike.
How It Works
- Step 1: Download the Excel file.
- Step 2: Review pre-entered Amarin Corporation data (historical and projected).
- Step 3: Adjust key assumptions (yellow cells) based on your analysis.
- Step 4: View automatic recalculations for Amarin Corporation’s intrinsic value.
- Step 5: Use the outputs for investment decisions or reporting.
Why Choose This Calculator for Amarin Corporation plc (AMRN)?
- Designed for Experts: A sophisticated tool utilized by financial analysts, investment managers, and industry consultants.
- Comprehensive Data: Amarin’s historical and projected financials are preloaded for precision.
- Flexible Scenario Analysis: Effortlessly simulate various forecasts and assumptions.
- Transparent Outputs: Instantly calculates intrinsic value, NPV, and essential financial metrics.
- User-Friendly: Step-by-step guidance ensures a smooth experience throughout.
Who Should Use This Product?
- Professional Investors: Develop comprehensive and accurate valuation models for assessing Amarin Corporation plc (AMRN) investments.
- Corporate Finance Teams: Evaluate valuation scenarios to inform strategic decisions within the organization.
- Consultants and Advisors: Deliver precise valuation insights to clients interested in Amarin Corporation plc (AMRN) stock.
- Students and Educators: Leverage real-world data to enhance learning and practice in financial modeling.
- Biotech Enthusiasts: Gain insights into how biotech firms like Amarin Corporation plc (AMRN) are valued in the healthcare market.
What the Template Contains
- Operating and Balance Sheet Data: Pre-filled Amarin Corporation historical data and forecasts, including revenue, EBITDA, EBIT, and capital expenditures.
- WACC Calculation: A dedicated sheet for Weighted Average Cost of Capital (WACC), including parameters like Beta, risk-free rate, and share price.
- DCF Valuation (Unlevered and Levered): Editable Discounted Cash Flow models showing intrinsic value with detailed calculations.
- Financial Statements: Pre-loaded financial statements (annual and quarterly) to support analysis.
- Key Ratios: Includes profitability, leverage, and efficiency ratios for Amarin Corporation.
- Dashboard and Charts: Visual summary of valuation outputs and assumptions to analyze results easily.
Disclaimer
All information, articles, and product details provided on this website are for general informational and educational purposes only. We do not claim any ownership over, nor do we intend to infringe upon, any trademarks, copyrights, logos, brand names, or other intellectual property mentioned or depicted on this site. Such intellectual property remains the property of its respective owners, and any references here are made solely for identification or informational purposes, without implying any affiliation, endorsement, or partnership.
We make no representations or warranties, express or implied, regarding the accuracy, completeness, or suitability of any content or products presented. Nothing on this website should be construed as legal, tax, investment, financial, medical, or other professional advice. In addition, no part of this site—including articles or product references—constitutes a solicitation, recommendation, endorsement, advertisement, or offer to buy or sell any securities, franchises, or other financial instruments, particularly in jurisdictions where such activity would be unlawful.
All content is of a general nature and may not address the specific circumstances of any individual or entity. It is not a substitute for professional advice or services. Any actions you take based on the information provided here are strictly at your own risk. You accept full responsibility for any decisions or outcomes arising from your use of this website and agree to release us from any liability in connection with your use of, or reliance upon, the content or products found herein.