
|
Alembic Pharmaceuticals Limited (Aplltd.NS) DCF Avaliação |
Totalmente Editável: Adapte-Se Às Suas Necessidades No Excel Ou Planilhas
Design Profissional: Modelos Confiáveis E Padrão Da Indústria
Pré-Construídos Para Uso Rápido E Eficiente
Compatível com MAC/PC, totalmente desbloqueado
Não É Necessária Experiência; Fácil De Seguir
Alembic Pharmaceuticals Limited (APLLTD.NS) Bundle
Descubra o verdadeiro valor da Alembic Pharmaceuticals Limited (APLLTDNS) com nossa calculadora DCF avançada! Ajuste as principais suposições, explore vários cenários e avalie como as mudanças afetam a avaliação da Alembic Pharmaceuticals - tudo dentro de um único modelo do Excel.
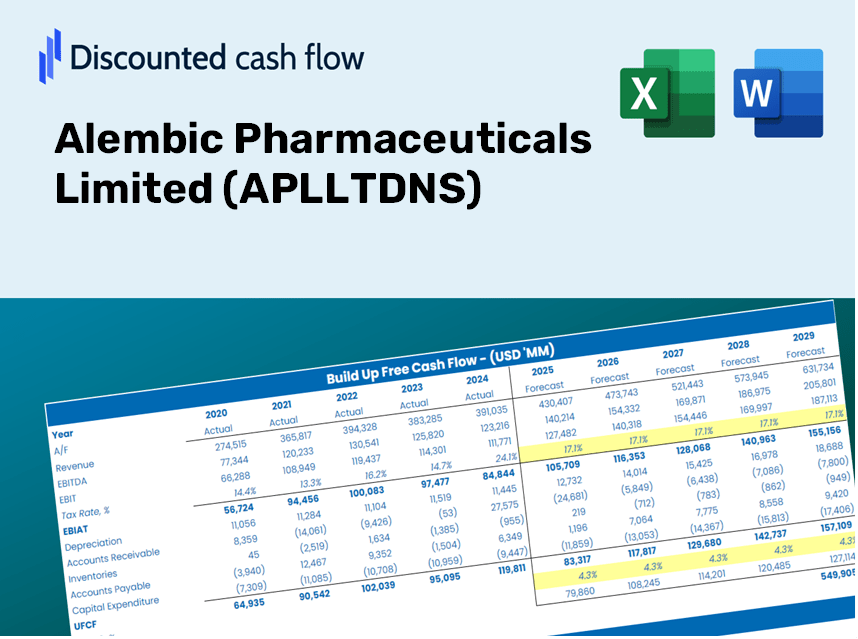
Discounted Cash Flow (DCF) - (USD MM)
| Year | AY1 2021 |
AY2 2022 |
AY3 2023 |
AY4 2024 |
AY5 2025 |
FY1 2026 |
FY2 2027 |
FY3 2028 |
FY4 2029 |
FY5 2030 |
|---|---|---|---|---|---|---|---|---|---|---|
| Revenue | 53,931.3 | 53,057.9 | 56,526.2 | 62,286.3 | 66,720.7 | 70,428.2 | 74,341.7 | 78,472.6 | 82,833.1 | 87,435.9 |
| Revenue Growth, % | 0 | -1.62 | 6.54 | 10.19 | 7.12 | 5.56 | 5.56 | 5.56 | 5.56 | 5.56 |
| EBITDA | 14,663.1 | 8,585.0 | 6,961.6 | 9,140.8 | 9,891.1 | 11,998.8 | 12,665.5 | 13,369.3 | 14,112.2 | 14,896.4 |
| EBITDA, % | 27.19 | 16.18 | 12.32 | 14.68 | 14.82 | 17.04 | 17.04 | 17.04 | 17.04 | 17.04 |
| Depreciation | 1,694.7 | 2,710.3 | 2,583.8 | 2,533.4 | 2,593.1 | 2,926.3 | 3,088.9 | 3,260.6 | 3,441.8 | 3,633.0 |
| Depreciation, % | 3.14 | 5.11 | 4.57 | 4.07 | 3.89 | 4.16 | 4.16 | 4.16 | 4.16 | 4.16 |
| EBIT | 12,968.4 | 5,874.7 | 4,377.8 | 6,607.4 | 7,298.0 | 9,072.5 | 9,576.6 | 10,108.7 | 10,670.5 | 11,263.4 |
| EBIT, % | 24.05 | 11.07 | 7.74 | 10.61 | 10.94 | 12.88 | 12.88 | 12.88 | 12.88 | 12.88 |
| Total Cash | 2,850.3 | 610.9 | 754.8 | 1,202.1 | 901.0 | 1,556.8 | 1,643.3 | 1,734.6 | 1,831.0 | 1,932.7 |
| Total Cash, percent | .0 | .0 | .0 | .0 | .0 | .0 | .0 | .0 | .0 | .0 |
| Account Receivables | 3,539.6 | 8,111.3 | 10,513.5 | 10,248.4 | 13,997.9 | 10,970.4 | 11,580.0 | 12,223.5 | 12,902.7 | 13,619.7 |
| Account Receivables, % | 6.56 | 15.29 | 18.6 | 16.45 | 20.98 | 15.58 | 15.58 | 15.58 | 15.58 | 15.58 |
| Inventories | 14,861.5 | 16,097.0 | 14,752.7 | 16,435.4 | 22,881.4 | 20,378.4 | 21,510.8 | 22,706.0 | 23,967.8 | 25,299.6 |
| Inventories, % | 27.56 | 30.34 | 26.1 | 26.39 | 34.29 | 28.93 | 28.93 | 28.93 | 28.93 | 28.93 |
| Accounts Payable | 6,687.7 | 7,063.9 | 6,798.1 | 7,356.4 | 8,798.9 | 8,837.1 | 9,328.2 | 9,846.5 | 10,393.7 | 10,971.2 |
| Accounts Payable, % | 12.4 | 13.31 | 12.03 | 11.81 | 13.19 | 12.55 | 12.55 | 12.55 | 12.55 | 12.55 |
| Capital Expenditure | -6,595.1 | -4,256.4 | -4,434.1 | -3,274.7 | -5,636.2 | -5,887.8 | -6,215.0 | -6,560.3 | -6,924.9 | -7,309.7 |
| Capital Expenditure, % | -12.23 | -8.02 | -7.84 | -5.26 | -8.45 | -8.36 | -8.36 | -8.36 | -8.36 | -8.36 |
| Tax Rate, % | 17.5 | 17.5 | 17.5 | 17.5 | 17.5 | 17.5 | 17.5 | 17.5 | 17.5 | 17.5 |
| EBITAT | 10,621.6 | 4,893.5 | 4,222.1 | 6,440.1 | 6,020.8 | 8,013.0 | 8,458.3 | 8,928.3 | 9,424.4 | 9,948.1 |
| Depreciation | ||||||||||
| Changes in Account Receivables | ||||||||||
| Changes in Inventories | ||||||||||
| Changes in Accounts Payable | ||||||||||
| Capital Expenditure | ||||||||||
| UFCF | -5,992.2 | -2,083.6 | 1,048.1 | 4,839.5 | -5,775.3 | 10,620.3 | 4,081.3 | 4,308.1 | 4,547.5 | 4,800.2 |
| WACC, % | 5.72 | 5.73 | 5.78 | 5.78 | 5.72 | 5.75 | 5.75 | 5.75 | 5.75 | 5.75 |
| PV UFCF | ||||||||||
| SUM PV UFCF | 24,603.5 | |||||||||
| Long Term Growth Rate, % | 4.00 | |||||||||
| Free cash flow (T + 1) | 4,992 | |||||||||
| Terminal Value | 285,958 | |||||||||
| Present Terminal Value | 216,265 | |||||||||
| Enterprise Value | 240,869 | |||||||||
| Net Debt | 11,674 | |||||||||
| Equity Value | 229,195 | |||||||||
| Diluted Shares Outstanding, MM | 197 | |||||||||
| Equity Value Per Share | 1,166.01 |
Benefits You Will Receive
- Pre-Filled Financial Model: Leverage Alembic Pharmaceuticals Limited's (APLLTDNS) actual data for accurate DCF valuation.
- Comprehensive Forecast Control: Modify revenue growth, profit margins, WACC, and other critical factors.
- Real-Time Calculations: Automatic updates provide immediate feedback as you adjust parameters.
- Professionally Curated Template: A polished Excel file tailored for high-quality valuation.
- Flexible and Reusable: Designed for adaptability, enabling multiple uses for in-depth forecasts.
Key Features
- Customizable Forecast Parameters: Adjust essential inputs such as sales growth, EBITDA %, and capital investments.
- Instant DCF Valuation: Computes intrinsic value, NPV, and other relevant metrics in real-time.
- Precision-Driven Accuracy: Leverages Alembic's actual financial data for realistic valuation results.
- Simplified Scenario Analysis: Easily experiment with various assumptions and evaluate results side by side.
- Efficiency Booster: Streamline the valuation process without the need to construct intricate models from the ground up.
How It Works
- Step 1: Download the Excel file.
- Step 2: Review pre-entered Alembic Pharmaceuticals Limited (APLLTDNS) data (historical and projected).
- Step 3: Adjust key assumptions (yellow cells) based on your analysis.
- Step 4: View automatic recalculations for Alembic Pharmaceuticals Limited’s intrinsic value.
- Step 5: Use the outputs for investment decisions or reporting.
Why Choose Alembic Pharmaceuticals Limited (APLLTDNS)?
- Save Time: Skip the lengthy analysis process – our tools are ready to go.
- Enhance Precision: Trustworthy financial data and methodologies minimize valuation errors.
- Completely Customizable: Adapt the model to suit your unique assumptions and forecasts.
- User-Friendly: Intuitive charts and outputs simplify the interpretation of results.
- Trusted by Industry Leaders: Crafted for professionals who prioritize accuracy and functionality.
Who Can Benefit from This Product?
- Investors: Evaluate Alembic Pharmaceuticals Limited's (APLLTDNS) valuation before making stock transactions.
- CFOs and Financial Analysts: Optimize valuation workflows and assess financial forecasts.
- Startup Founders: Discover how established pharmaceutical companies like Alembic are valued.
- Consultants: Provide comprehensive valuation reports for clients in the healthcare sector.
- Students and Educators: Utilize actual market data to learn and teach valuation methodologies.
Contents of the Template
- Pre-Filled Data: Contains Alembic Pharmaceuticals Limited's historical financials and projections.
- Discounted Cash Flow Model: An editable DCF valuation model featuring automatic calculations.
- Weighted Average Cost of Capital (WACC): A specific sheet for WACC calculations based on user-defined inputs.
- Key Financial Ratios: Assess Alembic Pharmaceuticals' profitability, efficiency, and leverage metrics.
- Customizable Inputs: Easily adjust revenue growth, profit margins, and tax rates.
- Clear Dashboard: Visualizations and tables summarizing the essential valuation outcomes.
Disclaimer
All information, articles, and product details provided on this website are for general informational and educational purposes only. We do not claim any ownership over, nor do we intend to infringe upon, any trademarks, copyrights, logos, brand names, or other intellectual property mentioned or depicted on this site. Such intellectual property remains the property of its respective owners, and any references here are made solely for identification or informational purposes, without implying any affiliation, endorsement, or partnership.
We make no representations or warranties, express or implied, regarding the accuracy, completeness, or suitability of any content or products presented. Nothing on this website should be construed as legal, tax, investment, financial, medical, or other professional advice. In addition, no part of this site—including articles or product references—constitutes a solicitation, recommendation, endorsement, advertisement, or offer to buy or sell any securities, franchises, or other financial instruments, particularly in jurisdictions where such activity would be unlawful.
All content is of a general nature and may not address the specific circumstances of any individual or entity. It is not a substitute for professional advice or services. Any actions you take based on the information provided here are strictly at your own risk. You accept full responsibility for any decisions or outcomes arising from your use of this website and agree to release us from any liability in connection with your use of, or reliance upon, the content or products found herein.