
|
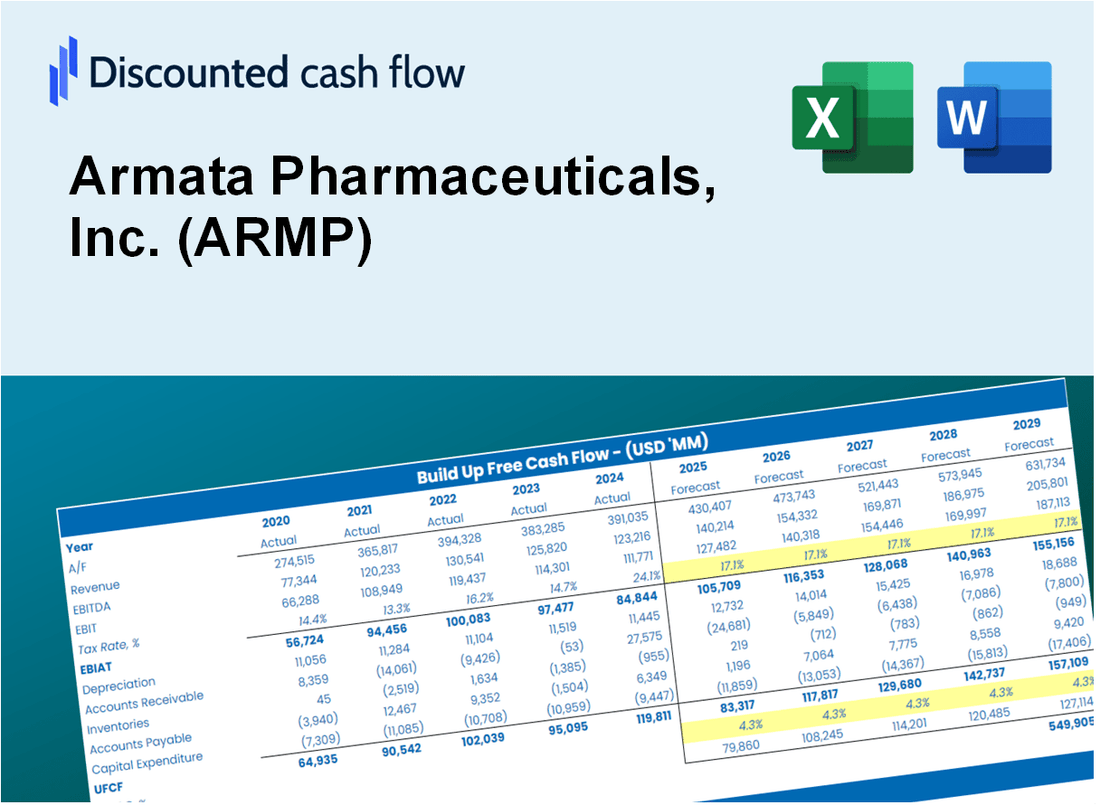
Avaliação DCF de Armata Pharmaceuticals, Inc. (ARMP) |
Totalmente Editável: Adapte-Se Às Suas Necessidades No Excel Ou Planilhas
Design Profissional: Modelos Confiáveis E Padrão Da Indústria
Pré-Construídos Para Uso Rápido E Eficiente
Compatível com MAC/PC, totalmente desbloqueado
Não É Necessária Experiência; Fácil De Seguir
Armata Pharmaceuticals, Inc. (ARMP) Bundle
Aprimore suas estratégias de investimento com a calculadora DCF Armata Pharmaceuticals, Inc. (ARMP)! Utilize dados financeiros reais, ajuste as projeções e despesas de crescimento e observe instantaneamente como essas mudanças afetam o valor intrínseco da Armata Pharmaceuticals, Inc. (ARMP).
What You Will Get
- Real Armata Data: Preloaded financials – from revenue to EBIT – based on actual and projected figures.
- Full Customization: Adjust all critical parameters (yellow cells) like WACC, growth %, and tax rates.
- Instant Valuation Updates: Automatic recalculations to analyze the impact of changes on Armata Pharmaceuticals’ fair value.
- Versatile Excel Template: Tailored for quick edits, scenario testing, and detailed projections.
- Time-Saving and Accurate: Skip building models from scratch while maintaining precision and flexibility.
Key Features
- Comprehensive Historical Data: Armata Pharmaceuticals’ financial statements and detailed forecasts.
- Customizable Parameters: Modify WACC, tax rates, revenue growth, and EBITDA margins as needed.
- Real-Time Valuation: View Armata Pharmaceuticals’ intrinsic value update instantly.
- Intuitive Visualizations: Dashboard graphs showcase valuation outcomes and essential metrics.
- Designed for Precision: A reliable tool for analysts, investors, and finance professionals.
How It Works
- Download: Obtain the pre-formatted Excel file containing Armata Pharmaceuticals' financial data.
- Customize: Modify projections, such as revenue growth, EBITDA %, and WACC.
- Update Automatically: The intrinsic value and NPV calculations refresh in real-time.
- Test Scenarios: Generate various forecasts and instantly compare results.
- Make Decisions: Leverage the valuation insights to inform your investment strategy.
Why Choose Armata Pharmaceuticals, Inc. (ARMP)?
- Innovative Solutions: Pioneering therapies that address unmet medical needs.
- Proven Expertise: Backed by a team of industry professionals with extensive experience.
- Robust Pipeline: A diverse range of product candidates in various stages of development.
- Commitment to Quality: Adherence to the highest standards in research and production.
- Community Focused: Dedicated to improving patient outcomes and enhancing healthcare.
Who Should Use This Product?
- Individual Investors: Make informed decisions about buying or selling Armata Pharmaceuticals stock (ARMP).
- Financial Analysts: Streamline valuation processes with ready-to-use financial models for Armata Pharmaceuticals (ARMP).
- Consultants: Deliver professional valuation insights about Armata Pharmaceuticals (ARMP) to clients quickly and accurately.
- Business Owners: Understand how biotech companies like Armata Pharmaceuticals (ARMP) are valued to guide your own strategy.
- Finance Students: Learn valuation techniques using real-world data and scenarios related to Armata Pharmaceuticals (ARMP).
What the Template Contains
- Comprehensive DCF Model: Editable template with detailed valuation calculations specific to Armata Pharmaceuticals, Inc. (ARMP).
- Real-World Data: Armata Pharmaceuticals’ historical and projected financials preloaded for analysis.
- Customizable Parameters: Adjust WACC, growth rates, and tax assumptions to test various scenarios.
- Financial Statements: Complete annual and quarterly breakdowns for deeper insights into Armata Pharmaceuticals' performance.
- Key Ratios: Built-in analysis for profitability, efficiency, and leverage metrics relevant to Armata Pharmaceuticals, Inc. (ARMP).
- Dashboard with Visual Outputs: Charts and tables for clear, actionable results tailored to Armata Pharmaceuticals.
Disclaimer
All information, articles, and product details provided on this website are for general informational and educational purposes only. We do not claim any ownership over, nor do we intend to infringe upon, any trademarks, copyrights, logos, brand names, or other intellectual property mentioned or depicted on this site. Such intellectual property remains the property of its respective owners, and any references here are made solely for identification or informational purposes, without implying any affiliation, endorsement, or partnership.
We make no representations or warranties, express or implied, regarding the accuracy, completeness, or suitability of any content or products presented. Nothing on this website should be construed as legal, tax, investment, financial, medical, or other professional advice. In addition, no part of this site—including articles or product references—constitutes a solicitation, recommendation, endorsement, advertisement, or offer to buy or sell any securities, franchises, or other financial instruments, particularly in jurisdictions where such activity would be unlawful.
All content is of a general nature and may not address the specific circumstances of any individual or entity. It is not a substitute for professional advice or services. Any actions you take based on the information provided here are strictly at your own risk. You accept full responsibility for any decisions or outcomes arising from your use of this website and agree to release us from any liability in connection with your use of, or reliance upon, the content or products found herein.