
|
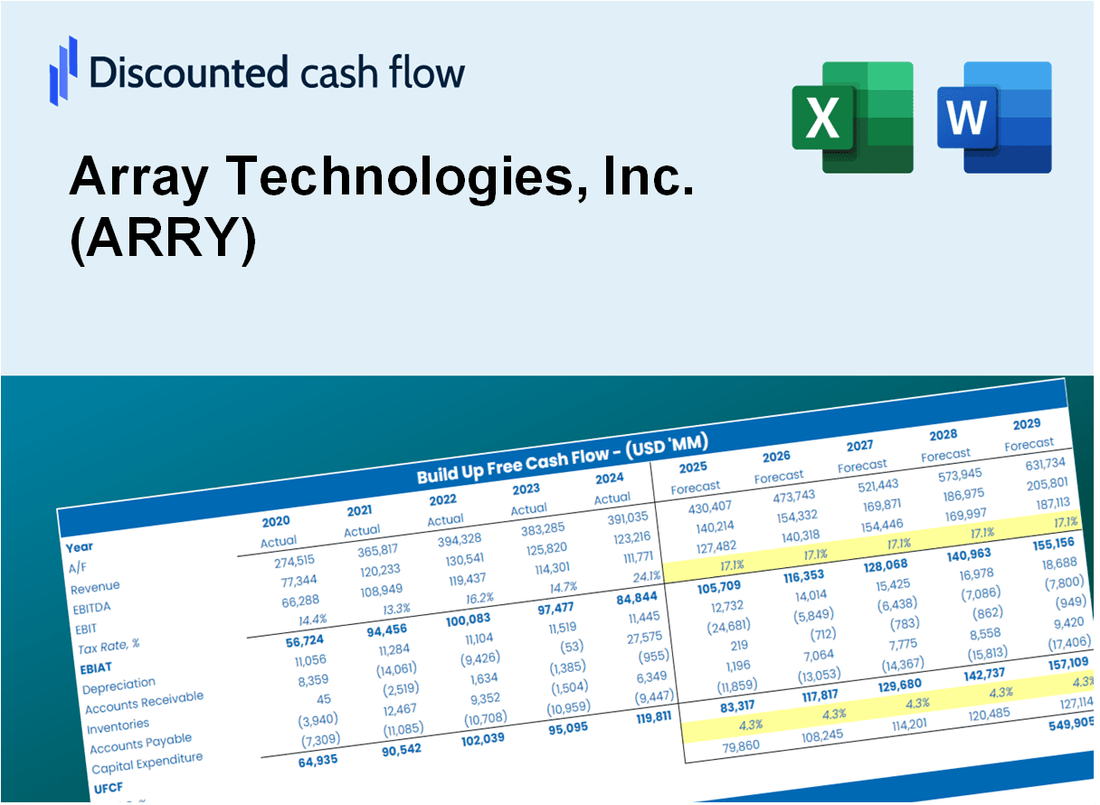
Avaliação DCF da Array Technologies, Inc. (ARRY) |
Totalmente Editável: Adapte-Se Às Suas Necessidades No Excel Ou Planilhas
Design Profissional: Modelos Confiáveis E Padrão Da Indústria
Pré-Construídos Para Uso Rápido E Eficiente
Compatível com MAC/PC, totalmente desbloqueado
Não É Necessária Experiência; Fácil De Seguir
Array Technologies, Inc. (ARRY) Bundle
Avalie as perspectivas financeiras da Array Technologies, Inc. (Arry) como um especialista! Essa calculadora DCF (Arry) vem com dados financeiros pré-preenchidos e oferece total flexibilidade para modificar o crescimento da receita, WACC, margens e outras suposições críticas para se alinhar às suas projeções.
Discounted Cash Flow (DCF) - (USD MM)
| Year | AY1 2020 |
AY2 2021 |
AY3 2022 |
AY4 2023 |
AY5 2024 |
FY1 2025 |
FY2 2026 |
FY3 2027 |
FY4 2028 |
FY5 2029 |
|---|---|---|---|---|---|---|---|---|---|---|
| Revenue | 872.7 | 853.3 | 1,637.5 | 1,576.6 | 915.8 | 1,049.7 | 1,203.2 | 1,379.2 | 1,580.9 | 1,812.1 |
| Revenue Growth, % | 0 | -2.22 | 91.9 | -3.72 | -41.91 | 14.62 | 14.62 | 14.62 | 14.62 | 14.62 |
| EBITDA | 149.1 | .5 | 132.8 | 276.2 | -163.0 | 52.5 | 60.1 | 68.9 | 79.0 | 90.5 |
| EBITDA, % | 17.09 | 0.05964951 | 8.11 | 17.52 | -17.8 | 5 | 5 | 5 | 5 | 5 |
| Depreciation | 27.5 | 25.9 | 101.1 | 54.8 | 52.8 | 45.4 | 52.0 | 59.6 | 68.3 | 78.3 |
| Depreciation, % | 3.15 | 3.04 | 6.17 | 3.48 | 5.76 | 4.32 | 4.32 | 4.32 | 4.32 | 4.32 |
| EBIT | 121.7 | -25.4 | 31.7 | 221.4 | -215.8 | 7.1 | 8.1 | 9.3 | 10.7 | 12.3 |
| EBIT, % | 13.94 | -2.98 | 1.94 | 14.04 | -23.56 | 0.67635 | 0.67635 | 0.67635 | 0.67635 | 0.67635 |
| Total Cash | 108.4 | 367.7 | 133.9 | 249.1 | 363.0 | 250.1 | 286.7 | 328.6 | 376.7 | 431.7 |
| Total Cash, percent | .0 | .0 | .0 | .0 | .0 | .0 | .0 | .0 | .0 | .0 |
| Account Receivables | 135.9 | 245.1 | 424.7 | 332.2 | 275.8 | 254.9 | 292.2 | 334.9 | 383.9 | 440.0 |
| Account Receivables, % | 15.57 | 28.72 | 25.94 | 21.07 | 30.12 | 24.28 | 24.28 | 24.28 | 24.28 | 24.28 |
| Inventories | 118.5 | 205.7 | 233.2 | 162.0 | 200.8 | 176.6 | 202.4 | 232.0 | 266.0 | 304.8 |
| Inventories, % | 13.57 | 24.1 | 14.24 | 10.27 | 21.93 | 16.82 | 16.82 | 16.82 | 16.82 | 16.82 |
| Accounts Payable | 85.0 | 92.0 | 170.4 | 119.5 | 172.4 | 120.4 | 138.0 | 158.1 | 181.3 | 207.8 |
| Accounts Payable, % | 9.74 | 10.78 | 10.41 | 7.58 | 18.82 | 11.47 | 11.47 | 11.47 | 11.47 | 11.47 |
| Capital Expenditure | -1.3 | -3.4 | -10.6 | -17.0 | -7.3 | -6.4 | -7.4 | -8.5 | -9.7 | -11.1 |
| Capital Expenditure, % | -0.15332 | -0.39341 | -0.64847 | -1.08 | -0.79766 | -0.61409 | -0.61409 | -0.61409 | -0.61409 | -0.61409 |
| Tax Rate, % | 4.06 | 4.06 | 4.06 | 4.06 | 4.06 | 4.06 | 4.06 | 4.06 | 4.06 | 4.06 |
| EBITAT | 92.4 | -21.0 | -28.4 | 171.5 | -207.0 | 4.7 | 5.4 | 6.2 | 7.1 | 8.1 |
| Depreciation | ||||||||||
| Changes in Account Receivables | ||||||||||
| Changes in Inventories | ||||||||||
| Changes in Accounts Payable | ||||||||||
| Capital Expenditure | ||||||||||
| UFCF | -50.8 | -187.8 | -66.7 | 322.2 | -91.2 | 36.8 | 4.5 | 5.2 | 5.9 | 6.8 |
| WACC, % | 8.84 | 8.96 | 7.47 | 8.87 | 9.2 | 8.67 | 8.67 | 8.67 | 8.67 | 8.67 |
| PV UFCF | ||||||||||
| SUM PV UFCF | 50.4 | |||||||||
| Long Term Growth Rate, % | 4.00 | |||||||||
| Free cash flow (T + 1) | 7 | |||||||||
| Terminal Value | 151 | |||||||||
| Present Terminal Value | 100 | |||||||||
| Enterprise Value | 150 | |||||||||
| Net Debt | 330 | |||||||||
| Equity Value | -180 | |||||||||
| Diluted Shares Outstanding, MM | 152 | |||||||||
| Equity Value Per Share | -1.18 |
What You Will Get
- Real Array Data: Preloaded financials – from revenue to EBIT – based on actual and projected figures for Array Technologies, Inc. (ARRY).
- Full Customization: Adjust all critical parameters (yellow cells) like WACC, growth %, and tax rates tailored to Array Technologies, Inc. (ARRY).
- Instant Valuation Updates: Automatic recalculations to analyze the impact of changes on Array Technologies, Inc.'s (ARRY) fair value.
- Versatile Excel Template: Designed for quick edits, scenario testing, and detailed projections specific to Array Technologies, Inc. (ARRY).
- Time-Saving and Accurate: Avoid building models from scratch while ensuring precision and flexibility for Array Technologies, Inc. (ARRY).
Key Features
- Customizable Forecast Inputs: Adjust essential metrics such as revenue growth, EBITDA %, and capital expenditures specific to Array Technologies, Inc. (ARRY).
- Instant DCF Valuation: Quickly computes intrinsic value, NPV, and other financial metrics for Array Technologies, Inc. (ARRY).
- High-Precision Accuracy: Leverages Array Technologies, Inc. (ARRY)'s actual financial data for credible valuation results.
- Effortless Scenario Analysis: Easily evaluate various assumptions and assess outcomes for Array Technologies, Inc. (ARRY) without hassle.
- Efficiency-Boosting Tool: Avoid the complexities of constructing detailed valuation models from the ground up for Array Technologies, Inc. (ARRY).
How It Works
- Download the Template: Get instant access to the Excel-based ARRY DCF Calculator.
- Input Your Assumptions: Adjust yellow-highlighted cells for growth rates, WACC, margins, and more.
- Instant Calculations: The model automatically updates Array Technologies, Inc.'s intrinsic value.
- Test Scenarios: Simulate different assumptions to evaluate potential valuation changes.
- Analyze and Decide: Use the results to guide your investment or financial analysis.
Why Choose Array Technologies, Inc. (ARRY)?
- Save Time: Quickly access comprehensive energy solutions without starting from scratch.
- Enhance Efficiency: Proven technologies optimize performance and minimize downtime.
- Fully Customizable: Adapt our systems to meet your specific renewable energy needs.
- User-Friendly Interface: Intuitive design makes it easy to navigate and utilize our services.
- Backed by Industry Leaders: Trusted by professionals in the renewable energy sector for reliability and innovation.
Who Should Use This Product?
- Finance Students: Master valuation methods and apply them with real-time data on Array Technologies, Inc. (ARRY).
- Academics: Utilize industry-standard models in your teaching or research involving Array Technologies, Inc. (ARRY).
- Investors: Validate your investment strategies and evaluate valuation results for Array Technologies, Inc. (ARRY).
- Analysts: Enhance your analysis process with a ready-to-use, customizable DCF model tailored for Array Technologies, Inc. (ARRY).
- Small Business Owners: Discover how major public companies like Array Technologies, Inc. (ARRY) are evaluated in the market.
What the Template Contains
- Preloaded ARRY Data: Historical and projected financial data, including revenue, EBIT, and capital expenditures.
- DCF and WACC Models: Professional-grade sheets for calculating intrinsic value and Weighted Average Cost of Capital.
- Editable Inputs: Yellow-highlighted cells for adjusting revenue growth, tax rates, and discount rates.
- Financial Statements: Comprehensive annual and quarterly financials for deeper analysis.
- Key Ratios: Profitability, leverage, and efficiency ratios to evaluate performance.
- Dashboard and Charts: Visual summaries of valuation outcomes and assumptions.
Disclaimer
All information, articles, and product details provided on this website are for general informational and educational purposes only. We do not claim any ownership over, nor do we intend to infringe upon, any trademarks, copyrights, logos, brand names, or other intellectual property mentioned or depicted on this site. Such intellectual property remains the property of its respective owners, and any references here are made solely for identification or informational purposes, without implying any affiliation, endorsement, or partnership.
We make no representations or warranties, express or implied, regarding the accuracy, completeness, or suitability of any content or products presented. Nothing on this website should be construed as legal, tax, investment, financial, medical, or other professional advice. In addition, no part of this site—including articles or product references—constitutes a solicitation, recommendation, endorsement, advertisement, or offer to buy or sell any securities, franchises, or other financial instruments, particularly in jurisdictions where such activity would be unlawful.
All content is of a general nature and may not address the specific circumstances of any individual or entity. It is not a substitute for professional advice or services. Any actions you take based on the information provided here are strictly at your own risk. You accept full responsibility for any decisions or outcomes arising from your use of this website and agree to release us from any liability in connection with your use of, or reliance upon, the content or products found herein.