
|
ASSOK LEYLAND LIMITED (Ashokley.NS) DCF Avaliação |
Totalmente Editável: Adapte-Se Às Suas Necessidades No Excel Ou Planilhas
Design Profissional: Modelos Confiáveis E Padrão Da Indústria
Pré-Construídos Para Uso Rápido E Eficiente
Compatível com MAC/PC, totalmente desbloqueado
Não É Necessária Experiência; Fácil De Seguir
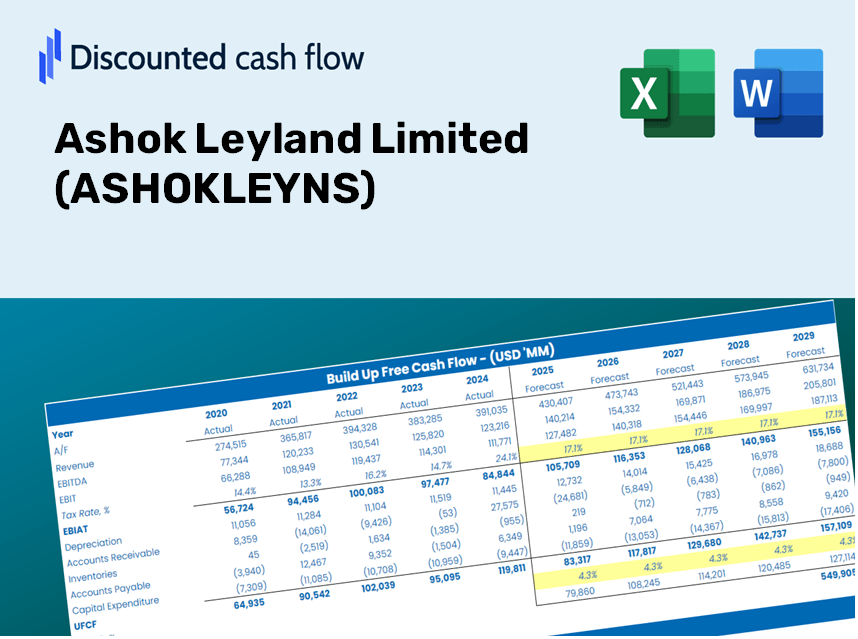
Ashok Leyland Limited (ASHOKLEY.NS) Bundle
Avalie as perspectivas financeiras da Ashok Leyland Limited como um especialista! Essa calculadora DCF (Ashokleyns) vem com dados financeiros pré-preenchidos e oferece total flexibilidade para modificar o crescimento da receita, o WACC, as margens e outras suposições essenciais para corresponder às suas previsões.
What You'll Receive
- Authentic ASHOKLEYNS Financials: Features historical data and future projections for precise valuation.
- Customizable Inputs: Adjust WACC, tax rates, revenue growth, and capital expenditure as needed.
- Real-Time Calculations: Intrinsic value and NPV are computed automatically.
- Scenario Analysis: Evaluate various scenarios to assess Ashok Leyland's prospective performance.
- User-Friendly and Professional Design: Crafted for industry experts while remaining accessible to newcomers.
Key Features
- Customizable Forecast Inputs: Adjust essential factors such as revenue growth, EBITDA %, and capital expenditures to suit your analysis.
- Instant DCF Valuation: Automatically determines intrinsic value, NPV, and other key metrics in real-time.
- Industry-Leading Precision: Leverages Ashok Leyland’s actual financial data for accurate and credible valuation results.
- Simplified Scenario Analysis: Effortlessly test various assumptions and evaluate different outcomes.
- Efficiency Booster: Streamline your workflow by eliminating the need to create intricate valuation models from the ground up.
How It Works
- Step 1: Download the Excel file for Ashok Leyland Limited (ASHOKLEYNS).
- Step 2: Examine the pre-filled financial data and forecasts for Ashok Leyland Limited.
- Step 3: Adjust key inputs such as revenue growth, WACC, and tax rates (highlighted cells).
- Step 4: Observe the DCF model refresh in real-time as you modify your assumptions.
- Step 5: Analyze the outputs and leverage the results for informed investment choices.
Why Opt for This Calculator?
- Reliable Data: Access accurate financials of Ashok Leyland Limited (ASHOKLEYNS) for dependable valuation outcomes.
- Customizable Options: Tailor essential parameters such as growth rates, WACC, and tax rates according to your forecasts.
- Efficient: Built-in calculations save you the hassle of starting from square one.
- Professional-Quality Tool: Crafted for investors, analysts, and consultants alike.
- User-Friendly Design: An intuitive structure and clear instructions ensure ease of use for everyone.
Who Can Benefit from This Product?
- Individual Investors: Make informed choices regarding the purchase or sale of Ashok Leyland Limited (ASHOKLEYNS) shares.
- Financial Analysts: Enhance valuation processes with readily available financial models tailored for Ashok Leyland Limited (ASHOKLEYNS).
- Consultants: Provide clients with accurate and timely valuation insights related to Ashok Leyland Limited (ASHOKLEYNS).
- Business Owners: Gain a better understanding of how companies like Ashok Leyland Limited (ASHOKLEYNS) are valued to inform your own business strategies.
- Finance Students: Explore valuation methodologies using real-world data and case studies involving Ashok Leyland Limited (ASHOKLEYNS).
Contents of the Template
- Comprehensive DCF Model: An editable template featuring in-depth valuation calculations.
- Real-World Data: Ashok Leyland Limited's (ASHOKLEYNS) historical and projected financials preloaded for thorough analysis.
- Customizable Parameters: Adjust WACC, growth rates, and tax assumptions to explore various scenarios.
- Financial Statements: Complete annual and quarterly breakdowns for enhanced insights.
- Key Ratios: Integrated analysis for profitability, efficiency, and leverage metrics.
- Dashboard with Visual Outputs: Visual aids including charts and tables for clear, actionable results.
Disclaimer
All information, articles, and product details provided on this website are for general informational and educational purposes only. We do not claim any ownership over, nor do we intend to infringe upon, any trademarks, copyrights, logos, brand names, or other intellectual property mentioned or depicted on this site. Such intellectual property remains the property of its respective owners, and any references here are made solely for identification or informational purposes, without implying any affiliation, endorsement, or partnership.
We make no representations or warranties, express or implied, regarding the accuracy, completeness, or suitability of any content or products presented. Nothing on this website should be construed as legal, tax, investment, financial, medical, or other professional advice. In addition, no part of this site—including articles or product references—constitutes a solicitation, recommendation, endorsement, advertisement, or offer to buy or sell any securities, franchises, or other financial instruments, particularly in jurisdictions where such activity would be unlawful.
All content is of a general nature and may not address the specific circumstances of any individual or entity. It is not a substitute for professional advice or services. Any actions you take based on the information provided here are strictly at your own risk. You accept full responsibility for any decisions or outcomes arising from your use of this website and agree to release us from any liability in connection with your use of, or reliance upon, the content or products found herein.