
|
Avaliação do DCF da ASM International NV (ASM.AS) |
Totalmente Editável: Adapte-Se Às Suas Necessidades No Excel Ou Planilhas
Design Profissional: Modelos Confiáveis E Padrão Da Indústria
Pré-Construídos Para Uso Rápido E Eficiente
Compatível com MAC/PC, totalmente desbloqueado
Não É Necessária Experiência; Fácil De Seguir
ASM International NV (ASM.AS) Bundle
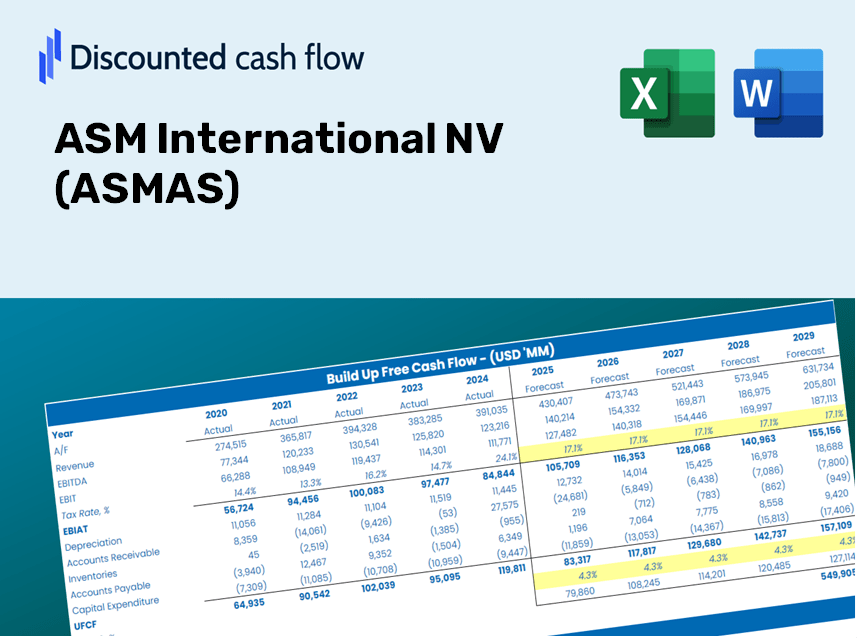
Seja você um investidor ou analista, esta calculadora DCF da ASM International NV (ASMAS) é seu recurso preferido para uma avaliação precisa. Carregado com dados reais da ASM International, você pode ajustar as previsões e observar os efeitos em tempo real.
What You Will Receive
- Pre-Configured Financial Model: Utilize ASM International NV's (ASMAS) actual data for accurate DCF valuation.
- Comprehensive Forecast Control: Modify revenue growth, profit margins, WACC, and other critical parameters.
- Real-Time Calculations: Automatic updates provide immediate visibility of results as adjustments are made.
- Professional-Grade Template: An expertly designed Excel file suitable for high-quality valuation presentations.
- Flexible and Reusable: Customizable for ongoing use, enabling detailed forecasts at any time.
Key Features
- Comprehensive DCF Calculator: Offers detailed unlevered and levered DCF valuation models tailored for ASM International NV (ASMAS).
- WACC Calculator: Features a pre-structured Weighted Average Cost of Capital sheet with customizable parameters.
- Edit-Friendly Forecast Assumptions: Easily adjust growth rates, capital expenditures, and discount rates as needed.
- Integrated Financial Ratios: Evaluate profitability, leverage, and efficiency ratios specific to ASM International NV (ASMAS).
- Interactive Dashboard and Charts: Visual representations provide a concise summary of key valuation metrics for straightforward analysis.
How It Functions
- Download: Obtain the pre-configured Excel file containing ASM International NV’s (ASMAS) financial data.
- Customize: Modify projections, including revenue growth, EBITDA percentage, and WACC as needed.
- Update Automatically: Watch as intrinsic value and NPV calculations refresh in real-time.
- Test Scenarios: Generate various projections and instantly compare their results.
- Make Decisions: Leverage the valuation outcomes to inform your investment strategy.
Why Choose This Calculator?
- Comprehensive Tool: Offers DCF, WACC, and financial ratio analyses all in one integrated solution.
- Customizable Inputs: Modify the yellow-highlighted fields to explore different financial scenarios.
- Detailed Insights: Automatically computes ASM International NV's (ASMAS) intrinsic value and Net Present Value.
- Preloaded Data: Features historical and projected data to provide reliable starting points for analysis.
- Professional Quality: Perfectly suited for financial analysts, investors, and business consultants.
Who Can Benefit from This Product?
- Finance Students: Master valuation techniques and practice with real-world data.
- Academics: Integrate established professional models into your research or teaching materials.
- Investors: Challenge your own assumptions and evaluate valuation scenarios for ASM International NV (ASMAS).
- Analysts: Enhance your efficiency with a ready-made, customizable DCF model.
- Small Business Owners: Understand the analytical methods used for large public companies like ASM International NV (ASMAS).
Contents of the Template
- In-Depth DCF Model: Editable template featuring comprehensive valuation calculations.
- Real-World Data: ASM International NV’s (ASMAS) historical and projected financials preloaded for in-depth analysis.
- Customizable Inputs: Modify WACC, growth rates, and tax assumptions to explore various scenarios.
- Financial Statements: Complete annual and quarterly breakdowns for enhanced insights.
- Key Ratios: Integrated analysis for profitability, efficiency, and leverage metrics.
- Interactive Dashboard with Visual Outputs: Charts and tables providing clear and actionable insights.
Disclaimer
All information, articles, and product details provided on this website are for general informational and educational purposes only. We do not claim any ownership over, nor do we intend to infringe upon, any trademarks, copyrights, logos, brand names, or other intellectual property mentioned or depicted on this site. Such intellectual property remains the property of its respective owners, and any references here are made solely for identification or informational purposes, without implying any affiliation, endorsement, or partnership.
We make no representations or warranties, express or implied, regarding the accuracy, completeness, or suitability of any content or products presented. Nothing on this website should be construed as legal, tax, investment, financial, medical, or other professional advice. In addition, no part of this site—including articles or product references—constitutes a solicitation, recommendation, endorsement, advertisement, or offer to buy or sell any securities, franchises, or other financial instruments, particularly in jurisdictions where such activity would be unlawful.
All content is of a general nature and may not address the specific circumstances of any individual or entity. It is not a substitute for professional advice or services. Any actions you take based on the information provided here are strictly at your own risk. You accept full responsibility for any decisions or outcomes arising from your use of this website and agree to release us from any liability in connection with your use of, or reliance upon, the content or products found herein.