
|
ASPEN GRUPO, Inc. (ASPU) Avaliação DCF |
Totalmente Editável: Adapte-Se Às Suas Necessidades No Excel Ou Planilhas
Design Profissional: Modelos Confiáveis E Padrão Da Indústria
Pré-Construídos Para Uso Rápido E Eficiente
Compatível com MAC/PC, totalmente desbloqueado
Não É Necessária Experiência; Fácil De Seguir
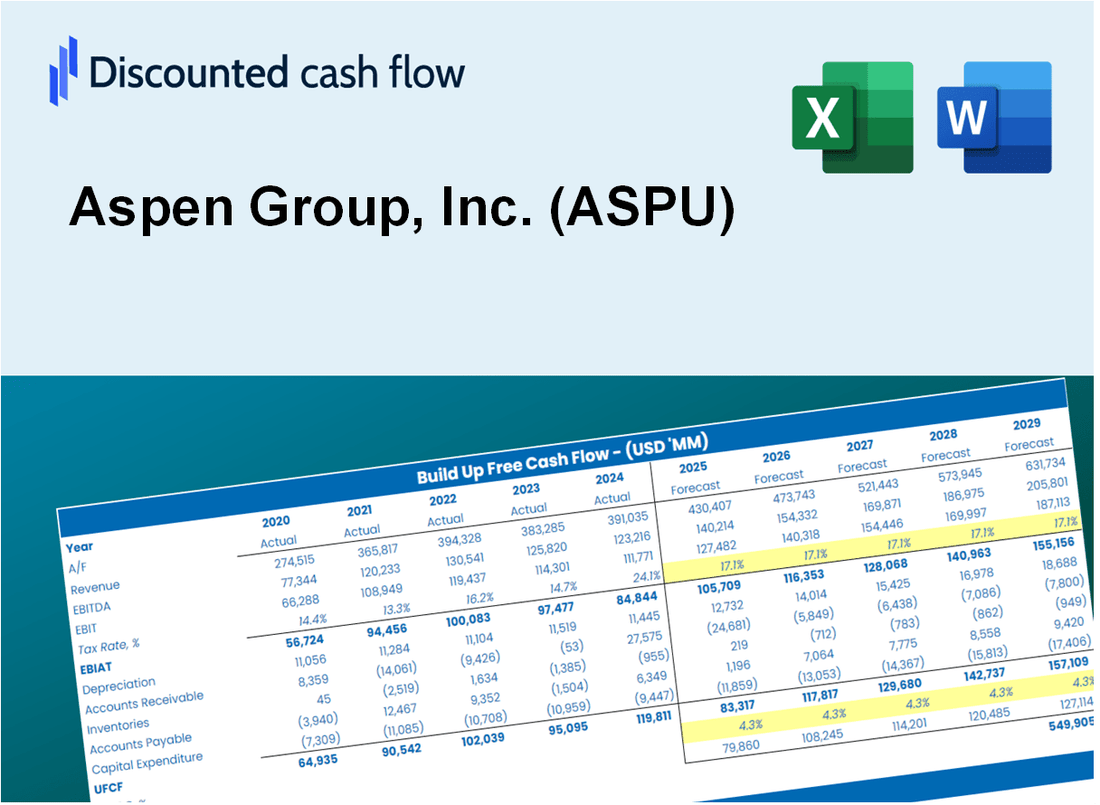
Aspen Group, Inc. (ASPU) Bundle
Avalie as perspectivas financeiras do ASPEN Group, Inc. (ASPU) como um especialista! Esta calculadora DCF (ASPU) fornece dados financeiros pré-preenchidos e flexibilidade para modificar o crescimento da receita, WACC, margens e outras suposições críticas para se alinhar com suas previsões.
What You Will Get
- Editable Forecast Inputs: Easily modify key assumptions (growth %, margins, WACC) to explore various scenarios.
- Real-World Data: Aspen Group, Inc. (ASPU)’s financial data pre-loaded to facilitate your analysis.
- Automatic DCF Outputs: The template computes Net Present Value (NPV) and intrinsic value automatically.
- Customizable and Professional: A sleek Excel model tailored to meet your valuation requirements.
- Built for Analysts and Investors: Perfect for examining projections, validating strategies, and enhancing efficiency.
Key Features
- Accurate Financial Data: Gain access to reliable pre-loaded historical figures and future forecasts for Aspen Group, Inc. (ASPU).
- Adjustable Forecast Parameters: Modify highlighted fields such as WACC, growth rates, and profit margins to suit your analysis.
- Real-Time Calculations: Enjoy automatic updates for DCF, Net Present Value (NPV), and cash flow assessments.
- Interactive Dashboard: User-friendly charts and summaries to help you visualize valuation outcomes effectively.
- Designed for All Levels: An intuitive layout tailored for investors, CFOs, and consultants alike.
How It Works
- Step 1: Download the Excel file.
- Step 2: Review pre-entered Aspen Group data (historical and projected).
- Step 3: Adjust key assumptions (yellow cells) based on your analysis.
- Step 4: View automatic recalculations for Aspen Group’s intrinsic value.
- Step 5: Use the outputs for investment decisions or reporting.
Why Choose This Calculator for Aspen Group, Inc. (ASPU)?
- Designed for Experts: A sophisticated tool utilized by financial analysts, CFOs, and industry consultants.
- Accurate Financial Data: Aspen Group’s historical and projected financials are preloaded for precision.
- Flexible Scenario Analysis: Effortlessly simulate various forecasts and assumptions.
- Comprehensive Outputs: Automatically computes intrinsic value, NPV, and essential financial metrics.
- User-Friendly: Step-by-step guidance makes the process straightforward.
Who Should Use Aspen Group, Inc. (ASPU)?
- Investors: Gain insights and make informed decisions with a comprehensive analysis of Aspen Group, Inc. (ASPU).
- Financial Analysts: Streamline your workflow with detailed reports tailored for Aspen Group, Inc. (ASPU).
- Consultants: Efficiently modify presentations or reports to showcase Aspen Group, Inc. (ASPU) to clients.
- Finance Enthusiasts: Enhance your knowledge of the education sector's market dynamics through Aspen Group, Inc. (ASPU) case studies.
- Educators and Students: Utilize it as a valuable resource for projects and discussions in finance and business courses.
What the Template Contains
- Preloaded ASPU Data: Historical and projected financial data, including revenue, EBIT, and capital expenditures.
- DCF and WACC Models: Professional-grade sheets for calculating intrinsic value and Weighted Average Cost of Capital.
- Editable Inputs: Yellow-highlighted cells for adjusting revenue growth, tax rates, and discount rates.
- Financial Statements: Comprehensive annual and quarterly financials for deeper analysis.
- Key Ratios: Profitability, leverage, and efficiency ratios to evaluate performance.
- Dashboard and Charts: Visual summaries of valuation outcomes and assumptions.
Disclaimer
All information, articles, and product details provided on this website are for general informational and educational purposes only. We do not claim any ownership over, nor do we intend to infringe upon, any trademarks, copyrights, logos, brand names, or other intellectual property mentioned or depicted on this site. Such intellectual property remains the property of its respective owners, and any references here are made solely for identification or informational purposes, without implying any affiliation, endorsement, or partnership.
We make no representations or warranties, express or implied, regarding the accuracy, completeness, or suitability of any content or products presented. Nothing on this website should be construed as legal, tax, investment, financial, medical, or other professional advice. In addition, no part of this site—including articles or product references—constitutes a solicitation, recommendation, endorsement, advertisement, or offer to buy or sell any securities, franchises, or other financial instruments, particularly in jurisdictions where such activity would be unlawful.
All content is of a general nature and may not address the specific circumstances of any individual or entity. It is not a substitute for professional advice or services. Any actions you take based on the information provided here are strictly at your own risk. You accept full responsibility for any decisions or outcomes arising from your use of this website and agree to release us from any liability in connection with your use of, or reliance upon, the content or products found herein.