
|
Astra Microwave Products Limited (Astramicro.NS) Avaliação DCF |
Totalmente Editável: Adapte-Se Às Suas Necessidades No Excel Ou Planilhas
Design Profissional: Modelos Confiáveis E Padrão Da Indústria
Pré-Construídos Para Uso Rápido E Eficiente
Compatível com MAC/PC, totalmente desbloqueado
Não É Necessária Experiência; Fácil De Seguir
Astra Microwave Products Limited (ASTRAMICRO.NS) Bundle
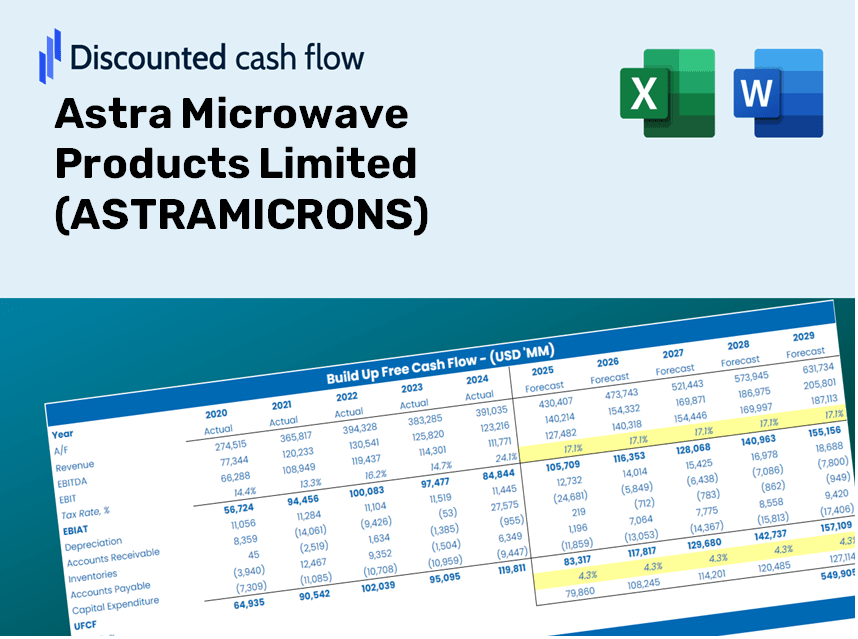
Maximize a eficiência e melhore a precisão com nossa calculadora (Astramicrons) DCF! Utilizando dados limitados de produtos limitados e personalizáveis de produtos de microondas Astra atualizados, essa ferramenta capacita você a prever, analisar e avaliar o Astra Microwave como um investidor especializado.
What You Will Receive
- Authentic ASTRAMICRONS Data: Comprehensive financials – from revenue to EBIT – derived from real and anticipated figures.
- Complete Customization: Modify all essential parameters (highlighted cells) such as WACC, growth %, and tax rates.
- Instant Valuation Adjustments: Automatic recalculations to assess the effects of changes on ASTRAMICRONS' fair value.
- Flexible Excel Template: Designed for swift modifications, scenario analysis, and in-depth forecasts.
- Time-Efficient and Precise: Avoid the hassle of building models from the ground up while ensuring accuracy and adaptability.
Key Features
- Pre-Loaded Data: Historical financial statements and pre-filled forecasts for Astra Microwave Products Limited (ASTRAMICRONS).
- Fully Adjustable Inputs: Customize parameters such as WACC, tax rates, revenue growth, and EBITDA margins.
- Instant Results: Witness the recalculation of Astra Microwave's intrinsic value in real time.
- Clear Visual Outputs: Dynamic dashboard charts present valuation results and essential metrics.
- Built for Accuracy: A professional-grade tool tailored for analysts, investors, and finance specialists.
How It Works
- Download: Get the pre-built Excel file containing Astra Microwave Products Limited's (ASTRAMICRONS) financial data.
- Customize: Modify projections such as revenue growth, EBITDA %, and WACC to suit your analysis.
- Update Automatically: The intrinsic value and NPV calculations refresh in real-time as you make adjustments.
- Test Scenarios: Develop various forecasts and compare results instantly for better insights.
- Make Decisions: Leverage the valuation findings to shape your investment strategy effectively.
Why Choose This Calculator for Astra Microwave Products Limited (ASTRAMICRONS)?
- User-Friendly Design: Perfectly suited for both novices and seasoned professionals.
- Customizable Inputs: Seamlessly adjust parameters to align with your analysis.
- Real-Time Updates: Witness immediate changes in Astra's valuation as you modify inputs.
- Preloaded Data: Comes equipped with Astra's actual financial figures for efficient evaluation.
- Relied Upon by Experts: A trusted tool among investors and analysts for making well-informed choices.
Who Can Benefit from This Product?
- Professional Investors: Develop comprehensive and accurate valuation models for portfolio evaluation.
- Corporate Finance Teams: Assess valuation scenarios to inform strategic planning.
- Consultants and Advisors: Deliver precise valuation insights for Astra Microwave Products Limited (ASTRAMICRONS) to your clients.
- Students and Educators: Leverage real-world data to enhance financial modeling skills and instruction.
- Tech Enthusiasts: Gain insight into the valuation of tech companies like Astra Microwave Products Limited (ASTRAMICRONS) in the marketplace.
Contents of the Template
- Pre-Filled DCF Model: ASTRAMICRONS' financial data preloaded for instant access.
- WACC Calculator: Comprehensive calculations for the Weighted Average Cost of Capital.
- Financial Ratios: Analyze ASTRAMICRONS' profitability, leverage, and operational efficiency.
- Editable Inputs: Adjust assumptions such as growth rates, margins, and CAPEX to suit your scenarios.
- Financial Statements: Annual and quarterly reports to facilitate in-depth analysis.
- Interactive Dashboard: Effortlessly visualize key valuation metrics and outcomes.
Disclaimer
All information, articles, and product details provided on this website are for general informational and educational purposes only. We do not claim any ownership over, nor do we intend to infringe upon, any trademarks, copyrights, logos, brand names, or other intellectual property mentioned or depicted on this site. Such intellectual property remains the property of its respective owners, and any references here are made solely for identification or informational purposes, without implying any affiliation, endorsement, or partnership.
We make no representations or warranties, express or implied, regarding the accuracy, completeness, or suitability of any content or products presented. Nothing on this website should be construed as legal, tax, investment, financial, medical, or other professional advice. In addition, no part of this site—including articles or product references—constitutes a solicitation, recommendation, endorsement, advertisement, or offer to buy or sell any securities, franchises, or other financial instruments, particularly in jurisdictions where such activity would be unlawful.
All content is of a general nature and may not address the specific circumstances of any individual or entity. It is not a substitute for professional advice or services. Any actions you take based on the information provided here are strictly at your own risk. You accept full responsibility for any decisions or outcomes arising from your use of this website and agree to release us from any liability in connection with your use of, or reliance upon, the content or products found herein.