
|
Avaliação DCF de Atossa Therapeutics, Inc. (ATOS) |
Totalmente Editável: Adapte-Se Às Suas Necessidades No Excel Ou Planilhas
Design Profissional: Modelos Confiáveis E Padrão Da Indústria
Pré-Construídos Para Uso Rápido E Eficiente
Compatível com MAC/PC, totalmente desbloqueado
Não É Necessária Experiência; Fácil De Seguir
Atossa Therapeutics, Inc. (ATOS) Bundle
Procurando avaliar o valor intrínseco de Atossa Therapeutics, Inc.? Nossa calculadora ATOS DCF integra dados do mundo real com extensos recursos de personalização, permitindo refinar suas projeções e fazer escolhas de investimento mais informadas.
What You Will Get
- Comprehensive ATOS Financials: Access both historical and projected data for precise valuation.
- Customizable Inputs: Adjust WACC, tax rates, revenue growth, and capital expenditures as needed.
- Dynamic Calculations: Intrinsic value and NPV are computed in real-time.
- Scenario Analysis: Explore various scenarios to assess Atossa Therapeutics' potential performance.
- User-Friendly Design: Designed for professionals while remaining approachable for newcomers.
Key Features
- Current ATOS Data: Pre-filled with Atossa Therapeutics’ historical financials and future projections.
- Customizable Metrics: Modify revenue growth rates, profit margins, discount rates, tax assumptions, and capital investments.
- Interactive Valuation Model: Automatically refreshes Net Present Value (NPV) and intrinsic value based on user inputs.
- Scenario Analysis: Develop various forecasting scenarios to explore different valuation possibilities.
- Intuitive Interface: Designed to be straightforward and accessible for both professionals and newcomers.
How It Works
- Step 1: Download the prebuilt Excel template containing Atossa Therapeutics, Inc.'s (ATOS) data.
- Step 2: Review the pre-filled sheets to grasp the essential metrics.
- Step 3: Modify forecasts and assumptions in the editable yellow cells (WACC, growth, margins).
- Step 4: Instantly access recalculated results, including Atossa Therapeutics, Inc.'s (ATOS) intrinsic value.
- Step 5: Make informed investment decisions or create reports utilizing the outputs.
Why Choose Atossa Therapeutics, Inc. (ATOS)?
- Innovative Solutions: Cutting-edge therapies designed to address unmet medical needs in breast cancer treatment.
- Commitment to Research: Robust clinical trials backed by scientific rigor ensure the highest levels of accuracy.
- Patient-Centric Approach: Focused on improving patient outcomes through personalized medicine.
- Experienced Team: Led by a team of experts with extensive knowledge in biotechnology and pharmaceuticals.
- Proven Track Record: Trusted by investors and healthcare professionals for our dedication to advancing treatment options.
Who Should Use Atossa Therapeutics, Inc. (ATOS)?
- Investors: Gain insights into the biotech sector with a cutting-edge analysis tool.
- Financial Analysts: Streamline your research with comprehensive data on Atossa's market performance.
- Consultants: Easily customize the information for client strategies or investment recommendations.
- Biotech Enthusiasts: Enhance your knowledge of innovative therapies and their market potential.
- Educators and Students: Utilize it as a resource for case studies in biotechnology and finance courses.
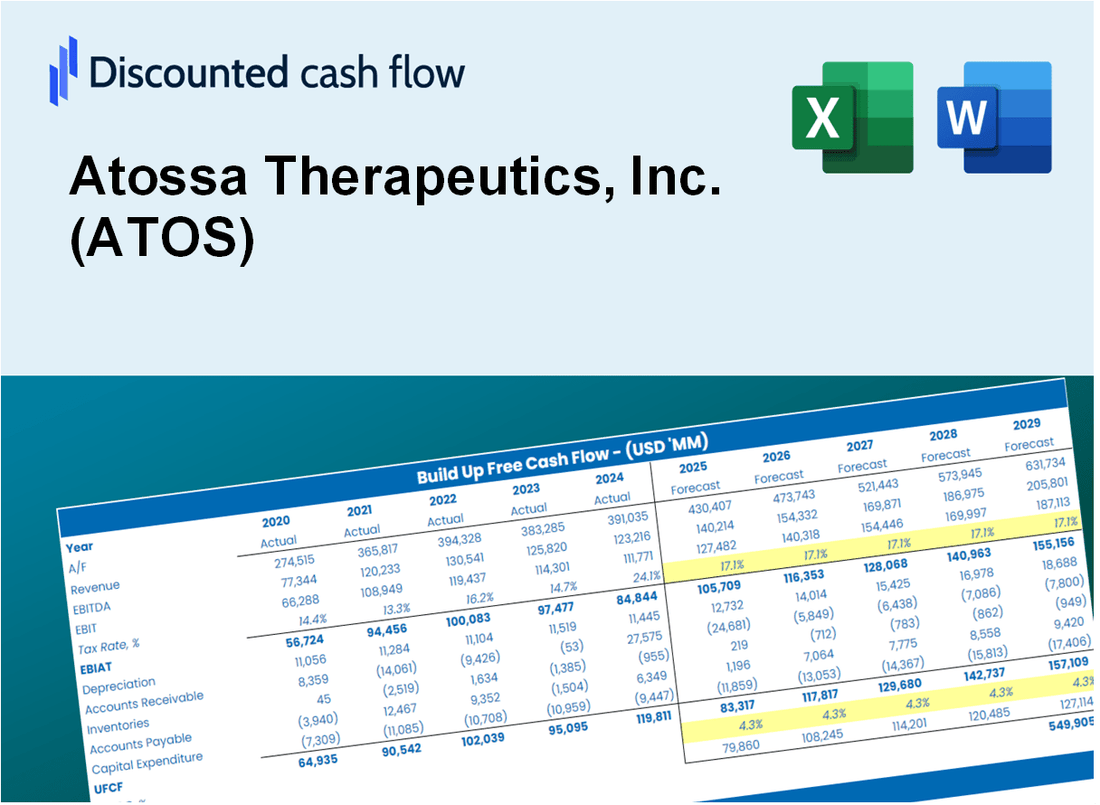
What the Template Contains
- Comprehensive DCF Model: Editable template featuring detailed valuation calculations specific to Atossa Therapeutics, Inc. (ATOS).
- Real-World Data: Atossa’s historical and projected financials preloaded for in-depth analysis.
- Customizable Parameters: Adjust WACC, growth rates, and tax assumptions to explore different scenarios.
- Financial Statements: Complete annual and quarterly breakdowns for enhanced insights.
- Key Ratios: Integrated analysis for profitability, efficiency, and leverage metrics.
- Dashboard with Visual Outputs: Charts and tables providing clear, actionable results.
Disclaimer
All information, articles, and product details provided on this website are for general informational and educational purposes only. We do not claim any ownership over, nor do we intend to infringe upon, any trademarks, copyrights, logos, brand names, or other intellectual property mentioned or depicted on this site. Such intellectual property remains the property of its respective owners, and any references here are made solely for identification or informational purposes, without implying any affiliation, endorsement, or partnership.
We make no representations or warranties, express or implied, regarding the accuracy, completeness, or suitability of any content or products presented. Nothing on this website should be construed as legal, tax, investment, financial, medical, or other professional advice. In addition, no part of this site—including articles or product references—constitutes a solicitation, recommendation, endorsement, advertisement, or offer to buy or sell any securities, franchises, or other financial instruments, particularly in jurisdictions where such activity would be unlawful.
All content is of a general nature and may not address the specific circumstances of any individual or entity. It is not a substitute for professional advice or services. Any actions you take based on the information provided here are strictly at your own risk. You accept full responsibility for any decisions or outcomes arising from your use of this website and agree to release us from any liability in connection with your use of, or reliance upon, the content or products found herein.