
|
Aurobindo Pharma Limited (auropharma.ns) Avaliação DCF |
Totalmente Editável: Adapte-Se Às Suas Necessidades No Excel Ou Planilhas
Design Profissional: Modelos Confiáveis E Padrão Da Indústria
Pré-Construídos Para Uso Rápido E Eficiente
Compatível com MAC/PC, totalmente desbloqueado
Não É Necessária Experiência; Fácil De Seguir
Aurobindo Pharma Limited (AUROPHARMA.NS) Bundle
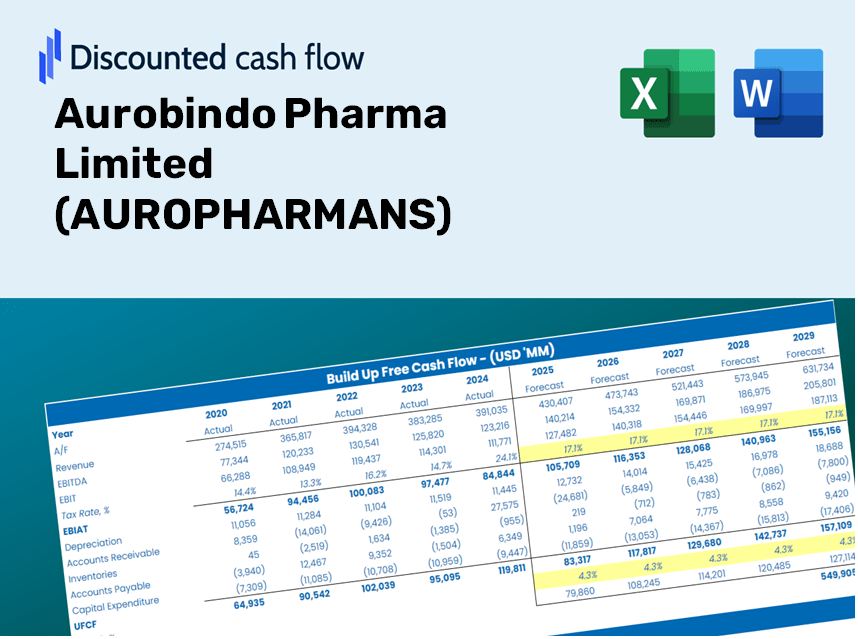
Avalie as perspectivas financeiras da Aurobindo Pharma Limited como um especialista! Essa calculadora DCF (auropharmanse) vem equipada com dados financeiros pré-preenchidos e oferece personalização completa para modificar o crescimento da receita, o WACC, as margens e outras suposições essenciais para se alinhar às suas previsões.
Discounted Cash Flow (DCF) - (USD MM)
| Year | AY1 2021 |
AY2 2022 |
AY3 2023 |
AY4 2024 |
AY5 2025 |
FY1 2026 |
FY2 2027 |
FY3 2028 |
FY4 2029 |
FY5 2030 |
|---|---|---|---|---|---|---|---|---|---|---|
| Revenue | 247,746.2 | 234,554.9 | 248,553.8 | 290,018.7 | 317,237.3 | 338,421.9 | 361,021.1 | 385,129.5 | 410,847.9 | 438,283.6 |
| Revenue Growth, % | 0 | -5.32 | 5.97 | 16.68 | 9.39 | 6.68 | 6.68 | 6.68 | 6.68 | 6.68 |
| EBITDA | 53,947.1 | 43,114.2 | 36,344.1 | 57,641.2 | 64,363.5 | 64,261.2 | 68,552.4 | 73,130.3 | 78,013.8 | 83,223.4 |
| EBITDA, % | 21.78 | 18.38 | 14.62 | 19.87 | 20.29 | 18.99 | 18.99 | 18.99 | 18.99 | 18.99 |
| Depreciation | 9,411.4 | 10,049.9 | 11,225.2 | 13,726.1 | 14,492.2 | 14,823.4 | 15,813.3 | 16,869.3 | 17,995.8 | 19,197.5 |
| Depreciation, % | 3.8 | 4.28 | 4.52 | 4.73 | 4.57 | 4.38 | 4.38 | 4.38 | 4.38 | 4.38 |
| EBIT | 44,535.7 | 33,064.3 | 25,118.9 | 43,915.1 | 49,871.3 | 49,437.8 | 52,739.2 | 56,261.0 | 60,018.0 | 64,025.9 |
| EBIT, % | 17.98 | 14.1 | 10.11 | 15.14 | 15.72 | 14.61 | 14.61 | 14.61 | 14.61 | 14.61 |
| Total Cash | 56,212.0 | 45,576.4 | 62,236.3 | 63,251.7 | 82,355.0 | 77,789.2 | 82,983.8 | 88,525.4 | 94,436.9 | 100,743.3 |
| Total Cash, percent | .0 | .0 | .0 | .0 | .0 | .0 | .0 | .0 | .0 | .0 |
| Account Receivables | 40,154.6 | 43,869.0 | 44,663.8 | 48,167.4 | 57,614.9 | 59,325.6 | 63,287.3 | 67,513.5 | 72,021.9 | 76,831.4 |
| Account Receivables, % | 16.21 | 18.7 | 17.97 | 16.61 | 18.16 | 17.53 | 17.53 | 17.53 | 17.53 | 17.53 |
| Inventories | 90,265.7 | 75,538.5 | 85,112.3 | 98,082.3 | 105,437.2 | 115,021.6 | 122,702.5 | 130,896.4 | 139,637.5 | 148,962.2 |
| Inventories, % | 36.43 | 32.21 | 34.24 | 33.82 | 33.24 | 33.99 | 33.99 | 33.99 | 33.99 | 33.99 |
| Accounts Payable | 27,946.8 | 27,030.5 | 38,713.1 | 44,541.6 | 41,888.5 | 45,309.5 | 48,335.1 | 51,562.9 | 55,006.2 | 58,679.4 |
| Accounts Payable, % | 11.28 | 11.52 | 15.58 | 15.36 | 13.2 | 13.39 | 13.39 | 13.39 | 13.39 | 13.39 |
| Capital Expenditure | -18,738.1 | -27,046.4 | -27,204.0 | -35,615.0 | -19,678.6 | -32,842.3 | -35,035.4 | -37,375.0 | -39,870.9 | -42,533.4 |
| Capital Expenditure, % | -7.56 | -11.53 | -10.94 | -12.28 | -6.2 | -9.7 | -9.7 | -9.7 | -9.7 | -9.7 |
| Tax Rate, % | 31.19 | 31.19 | 31.19 | 31.19 | 31.19 | 31.19 | 31.19 | 31.19 | 31.19 | 31.19 |
| EBITAT | 32,353.5 | 25,960.9 | 18,532.7 | 31,813.2 | 34,314.1 | 36,207.3 | 38,625.1 | 41,204.4 | 43,956.0 | 46,891.3 |
| Depreciation | ||||||||||
| Changes in Account Receivables | ||||||||||
| Changes in Inventories | ||||||||||
| Changes in Accounts Payable | ||||||||||
| Capital Expenditure | ||||||||||
| UFCF | -79,446.7 | 19,060.9 | 3,867.9 | -720.8 | 9,672.2 | 10,314.3 | 10,786.1 | 11,506.3 | 12,274.7 | 13,094.4 |
| WACC, % | 4.62 | 4.65 | 4.62 | 4.61 | 4.59 | 4.62 | 4.62 | 4.62 | 4.62 | 4.62 |
| PV UFCF | ||||||||||
| SUM PV UFCF | 50,456.4 | |||||||||
| Long Term Growth Rate, % | 4.00 | |||||||||
| Free cash flow (T + 1) | 13,618 | |||||||||
| Terminal Value | 2,199,704 | |||||||||
| Present Terminal Value | 1,755,131 | |||||||||
| Enterprise Value | 1,805,588 | |||||||||
| Net Debt | 274 | |||||||||
| Equity Value | 1,805,314 | |||||||||
| Diluted Shares Outstanding, MM | 583 | |||||||||
| Equity Value Per Share | 3,097.28 |
What You Will Receive
- Flexible Forecast Inputs: Effortlessly adjust variables (growth %, profit margins, WACC) to explore various scenarios.
- Actual Market Data: Aurobindo Pharma's financial data preloaded to enhance your analysis.
- Automated DCF Calculations: The template computes Net Present Value (NPV) and intrinsic value automatically.
- Tailored and Professional: A refined Excel model designed to meet your valuation requirements.
- Designed for Analysts and Investors: Perfect for testing forecasts, assessing strategies, and optimizing efficiency.
Key Features
- Comprehensive DCF Calculator: Features detailed unlevered and levered DCF valuation models tailored for Aurobindo Pharma Limited (AUROPHARMANS).
- WACC Calculator: Ready-to-use Weighted Average Cost of Capital sheet with flexible input options.
- Customizable Forecast Assumptions: Adjust growth rates, capital expenditures, and discount rates as needed.
- Integrated Financial Ratios: Evaluate profitability, leverage, and efficiency ratios specific to Aurobindo Pharma Limited (AUROPHARMANS).
- Interactive Dashboard and Graphs: Visual representations that summarize key valuation metrics for straightforward analysis.
How It Works
- Step 1: Download the Excel file.
- Step 2: Review the pre-filled data for Aurobindo Pharma Limited (AUROPHARMANS), including historical and projected figures.
- Step 3: Modify the key assumptions highlighted in yellow based on your own analysis.
- Step 4: Observe the automatic recalculations reflecting Aurobindo Pharma's (AUROPHARMANS) intrinsic value.
- Step 5: Utilize the results for making informed investment decisions or for reporting purposes.
Why Choose This Calculator for Aurobindo Pharma Limited (AUROPHARMANS)?
- User-Friendly Design: Suitable for both novices and seasoned professionals.
- Customizable Inputs: Modify parameters easily to tailor your analysis.
- Real-Time Valuation Updates: Observe immediate adjustments in Aurobindo’s valuation with input changes.
- Pre-Loaded Financials: Comes equipped with Aurobindo’s actual financial data for swift assessments.
- Relied Upon by Experts: Favored by investors and analysts for making well-informed choices.
Who Should Use This Product?
- Professional Investors: Develop comprehensive and accurate valuation models for evaluating portfolios related to Aurobindo Pharma Limited (AUROPHARMANS).
- Corporate Finance Teams: Assess various valuation scenarios to inform strategic decisions within the company.
- Consultants and Advisors: Deliver precise valuation insights for clients focusing on Aurobindo Pharma Limited (AUROPHARMANS).
- Students and Educators: Utilize real-world data to enhance learning in financial modeling and analysis.
- Pharma Enthusiasts: Gain an understanding of how pharmaceutical companies like Aurobindo Pharma Limited (AUROPHARMANS) are valued in the market.
Contents of the Template
- Preloaded AUROPHARMANS Data: Historical and projected financial data, encompassing revenue, EBIT, and capital expenditures.
- DCF and WACC Models: Professional-grade sheets designed for calculating intrinsic value and Weighted Average Cost of Capital.
- Editable Inputs: Yellow-highlighted cells for modifying revenue growth, tax rates, and discount rates.
- Financial Statements: Detailed annual and quarterly financials for in-depth analysis.
- Key Ratios: Profitability, leverage, and efficiency ratios to assess performance.
- Dashboard and Charts: Visual representations of valuation results and underlying assumptions.
Disclaimer
All information, articles, and product details provided on this website are for general informational and educational purposes only. We do not claim any ownership over, nor do we intend to infringe upon, any trademarks, copyrights, logos, brand names, or other intellectual property mentioned or depicted on this site. Such intellectual property remains the property of its respective owners, and any references here are made solely for identification or informational purposes, without implying any affiliation, endorsement, or partnership.
We make no representations or warranties, express or implied, regarding the accuracy, completeness, or suitability of any content or products presented. Nothing on this website should be construed as legal, tax, investment, financial, medical, or other professional advice. In addition, no part of this site—including articles or product references—constitutes a solicitation, recommendation, endorsement, advertisement, or offer to buy or sell any securities, franchises, or other financial instruments, particularly in jurisdictions where such activity would be unlawful.
All content is of a general nature and may not address the specific circumstances of any individual or entity. It is not a substitute for professional advice or services. Any actions you take based on the information provided here are strictly at your own risk. You accept full responsibility for any decisions or outcomes arising from your use of this website and agree to release us from any liability in connection with your use of, or reliance upon, the content or products found herein.