
|
Axalta Coating Systems Ltd. (AXTA): 5 forças Análise [Jan-2025 Atualizada] |
Totalmente Editável: Adapte-Se Às Suas Necessidades No Excel Ou Planilhas
Design Profissional: Modelos Confiáveis E Padrão Da Indústria
Pré-Construídos Para Uso Rápido E Eficiente
Compatível com MAC/PC, totalmente desbloqueado
Não É Necessária Experiência; Fácil De Seguir
Axalta Coating Systems Ltd. (AXTA) Bundle
No mundo dinâmico de revestimentos especializados, a Axalta Coating Systems Ltd. navega em um cenário competitivo complexo onde o posicionamento estratégico é tudo. Ao dissecar as forças críticas que moldam seu ecossistema de negócios, revelamos a intrincada dinâmica de sobrevivência e crescimento em uma indústria altamente competitiva. Desde o delicado equilíbrio das relações de fornecedores até a pressão incansável das demandas dos clientes e as interrupções tecnológicas, a resiliência estratégica de Axalta surge através de uma compreensão diferenciada das cinco forças competitivas de Michael Porter que definem seu posicionamento de mercado em 2024.
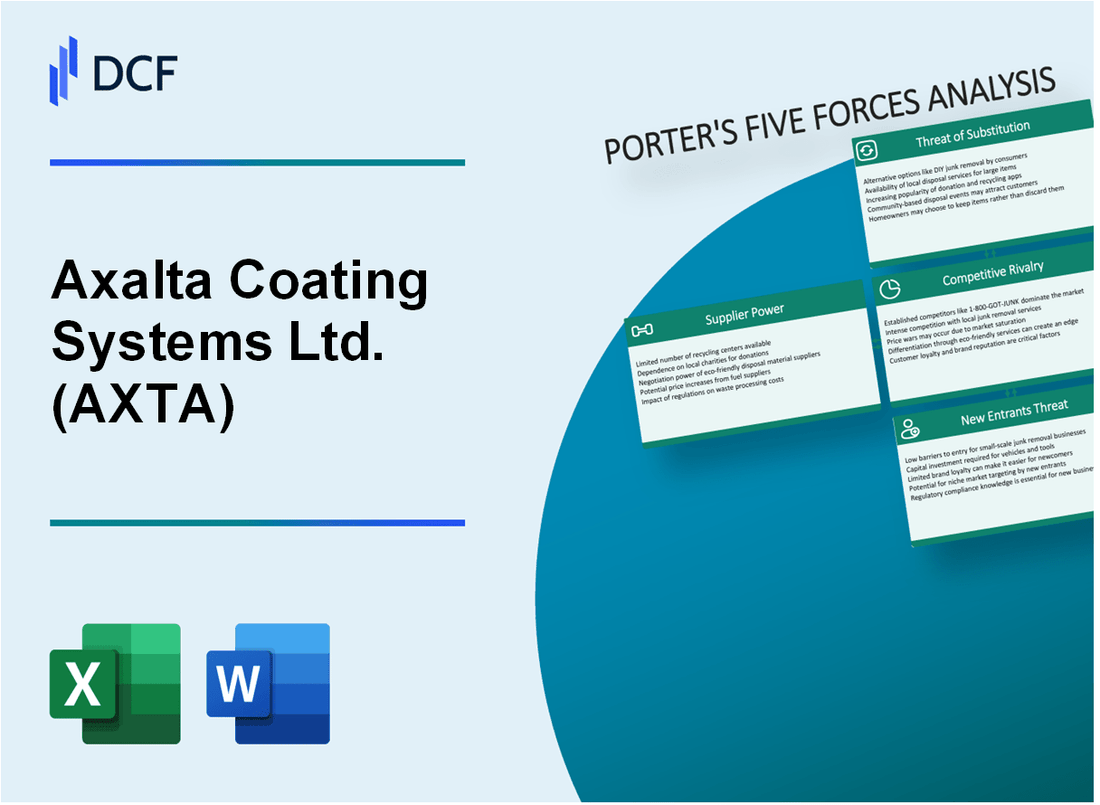
Axalta Coating Systems Ltd. (AXTA) - As cinco forças de Porter: poder de barganha dos fornecedores
Número limitado de fornecedores de matéria -prima para produtos químicos de revestimento especializados
A partir de 2024, a Axalta depende de aproximadamente 12 a 15 fornecedores químicos especializados em todo o mundo. O mercado global de produtos químicos especializados para revestimentos foi avaliado em US $ 63,4 bilhões em 2023.
| Categoria de fornecedores | Número de fornecedores -chave | Concentração de mercado |
|---|---|---|
| Fabricantes de resina | 4-6 | 62% de participação de mercado |
| Fornecedores de pigmentos | 3-5 | 55% de participação de mercado |
| Aditivos especializados | 5-6 | 48% de participação de mercado |
Altos custos de comutação para fornecedores
Os custos de troca de fornecedores têm uma média de US $ 1,2-1,7 milhões por reconfiguração da linha de produção. O processo de qualificação técnica leva de 12 a 18 meses.
- Teste de conformidade: US $ 450.000 a US $ 750.000
- Modificação da linha de produção: US $ 650.000 a US $ 950.000
- Processo de certificação: 6-9 meses
Requisitos de investimento para padrões de qualidade
Os fornecedores devem investir US $ 2,3-3,5 milhões para atender às especificações de qualidade da Axalta. Os custos anuais de auditoria da qualidade variam de US $ 175.000 a US $ 250.000.
Integração vertical potencial
O investimento em P&D da Axalta em 2023 foi de US $ 187 milhões. A integração vertical potencial pode reduzir a dependência do fornecedor em 22-28%.
| Área de integração | Investimento estimado | Economia potencial |
|---|---|---|
| Produção de resina | US $ 45-65 milhões | 15-20% Redução de custos |
| Fabricação de pigmentos | US $ 35-50 milhões | 12-18% Redução de custos |
Axalta Coating Systems Ltd. (AXTA) - As cinco forças de Porter: poder de barganha dos clientes
Base de clientes concentrados em mercados de revestimento automotivo e industrial
A partir de 2024, Axalta serve aproximadamente 135.000 clientes Globalmente nos segmentos de revestimento automotivo e industrial. Os 10 principais clientes representam 42,3% da receita total.
| Segmento de clientes | Contribuição da receita | Quota de mercado |
|---|---|---|
| OEM automotivo | 38.5% | 15.7% |
| Revestimentos industriais | 29.7% | 12.4% |
| Refinando | 31.8% | 11.9% |
Sensibilidade ao preço na indústria de revestimento competitivo
A elasticidade média do preço do revestimento em 2024 é -1.2, indicando sensibilidade moderada ao preço do cliente. As flutuações de custo da matéria -prima afetam o preço de preços aproximadamente 7.3% anualmente.
Demanda de clientes por soluções de revestimento personalizadas de alta qualidade
- Investimento em P&D: US $ 187 milhões em 2024
- Ciclos de desenvolvimento de novos produtos: 12-18 meses
- Solicitações de solução de revestimento personalizado: 64% de consultas totais de clientes
Contratos de longo prazo com os principais fabricantes automotivos
O portfólio de contratos atual inclui 17 principais fabricantes automotivos com duração média do contrato de 5,6 anos. Valor do contrato varia de US $ 45 milhões a US $ 210 milhões anualmente.
| Fabricante automotivo | Valor do contrato | Duração do contrato |
|---|---|---|
| General Motors | US $ 187 milhões | 6 anos |
| Ford | US $ 156 milhões | 5 anos |
| Toyota | US $ 210 milhões | 7 anos |
Axalta Coating Systems Ltd. (AXTA) - As cinco forças de Porter: rivalidade competitiva
Cenário competitivo global
Axalta enfrenta intensa concorrência dos principais fabricantes globais de revestimento:
| Concorrente | Receita Global (2022) | Quota de mercado |
|---|---|---|
| PPG Industries | US $ 16,8 bilhões | 15.7% |
| Sherwin-Williams | US $ 22,5 bilhões | 18.3% |
| Sistemas de revestimento Axalta | US $ 4,9 bilhões | 5.2% |
Investimento de pesquisa e desenvolvimento
Gastos competitivos em P&D em 2022:
- Despesas de P&D Axalta: US $ 218 milhões
- PPG Industries R&D Despesas: US $ 420 milhões
- Despesas de P&D de Sherwin-Williams: US $ 385 milhões
Presença de mercado
| Região | Participação de mercado Axalta | Número de concorrentes |
|---|---|---|
| América do Norte | 6.5% | 12 |
| Europa | 7.3% | 15 |
| Ásia-Pacífico | 4.8% | 20 |
Inovação tecnológica
Registros de patentes em 2022:
- Axalta: 47 novas patentes
- PPG Industries: 63 novas patentes
- Sherwin-Williams: 55 novas patentes
Axalta Coating Systems Ltd. (AXTA) - As cinco forças de Porter: ameaça de substitutos
Tecnologias e materiais de revestimento alternativos emergentes
A partir de 2024, o mercado global de tecnologias de revestimento alternativo deve atingir US $ 89,7 bilhões, com um CAGR de 6,3%. Axalta enfrenta a concorrência de tecnologias emergentes, como:
| Tecnologia | Impacto na participação de mercado | Crescimento projetado |
|---|---|---|
| Revestimentos de cerâmica | 3,2% de penetração no mercado | 8,7% de crescimento anual |
| Revestimentos em pó | 4,5% de participação de mercado | 7,2% de crescimento anual |
| Revestimentos de silicone líquido | 2,1% de penetração no mercado | 9,3% de crescimento anual |
Soluções de revestimento ecológicas e sustentáveis
Dinâmica do mercado de revestimento sustentável:
- Tamanho do mercado global de revestimentos verdes: US $ 62,4 bilhões em 2024
- Crescimento do mercado projetado: 6,8% CAGR até 2029
- Revestimentos à base de água Valor de mercado: US $ 42,3 bilhões
Substitutos avançados de polímero e nanotecnologia
Estatísticas do mercado de revestimento de nanotecnologia:
| Segmento de nanotecnologia | Valor de mercado | Taxa de crescimento |
|---|---|---|
| Nanocoatings | US $ 14,6 bilhões | 11,2% CAGR |
| Revestimentos autoliminatórios | US $ 3,7 bilhões | 9,5% CAGR |
Alternativas baseadas em desempenho
Insights de mercado de revestimento de desempenho:
- Mercado de revestimentos de alto desempenho: US $ 54,8 bilhões
- Alternativas de revestimento aeroespacial: US $ 6,2 bilhões
- Revestimentos especializados automotivos: US $ 12,7 bilhões
Axalta Coating Systems Ltd. (AXTA) - As cinco forças de Porter: ameaça de novos participantes
Requisitos de capital para revestimento de instalações de fabricação
As instalações de fabricação de revestimento da Axalta requerem investimento inicial substancial. Em 2023, as despesas de capital estimadas para uma nova instalação de fabricação de revestimento varia entre US $ 50 milhões e US $ 150 milhões.
| Categoria de investimento | Faixa de custo estimada |
|---|---|
| Aquisição de terras | US $ 5-15 milhões |
| Equipamento de fabricação | US $ 30-80 milhões |
| Infraestrutura de pesquisa e desenvolvimento | US $ 10-25 milhões |
| Configuração de conformidade regulatória | US $ 5-30 milhões |
Conhecimentos técnicos e recursos de pesquisa
Os requisitos de investimento em pesquisa e desenvolvimento são significativos. A Axalta gastou US $ 204 milhões em P&D em 2022, representando 3,4% de sua receita total.
- Tamanho mínimo da equipe de P&D: 50-100 pesquisadores especializados
- Salário médio do cientista de pesquisa: US $ 95.000 a US $ 135.000 anualmente
- Custo avançado de equipamentos de laboratório: US $ 2-5 milhões
Conformidade regulatória e padrões ambientais
Os custos de conformidade dos regulamentos ambientais e de segurança são substanciais. O gasto médio anual de conformidade regulamentar varia de US $ 3-7 milhões para fabricantes de revestimento.
| Área de conformidade regulatória | Estimativa anual de custos |
|---|---|
| Certificações ambientais | US $ 1-2 milhões |
| Conformidade de segurança | US $ 1,5-3 milhão |
| Sistemas de controle de qualidade | US $ 0,5-2 milhões |
Reputação da marca e relacionamentos com o cliente
A presença de mercado da Axalta requer investimento significativo na construção da marca. As despesas de marketing e vendas de 2022 da empresa totalizaram US $ 612 milhões.
- Custo médio de aquisição de clientes: US $ 50.000 a US $ 250.000 por cliente industrial
- Taxa de retenção de clientes: aproximadamente 85-90%
- Duração média do relacionamento do cliente: 7-10 anos
Axalta Coating Systems Ltd. (AXTA) - Porter's Five Forces: Competitive rivalry
You're looking at a space where scale matters, and right now, the competitive rivalry for Axalta Coating Systems Ltd. is defined by the presence of global giants. Rivalry is intense with established players like PPG Industries, Sherwin-Williams, and AkzoNobel all vying for share across the refinish, mobility, and industrial segments. To be fair, the coatings market generally feels mature, which naturally leads to continuous price pressure and a constant need to focus on operational efficiency just to keep pace.
The biggest immediate shift in this rivalry dynamic is the proposed all-stock merger with AkzoNobel, announced on November 18, 2025. This deal, structured as a merger of equals, will fundamentally reshape the competitive landscape by creating a coatings powerhouse. Here are the quick numbers on what that combination means for scale:
| Metric | Value |
|---|---|
| Combined Enterprise Value (Approximate) | $25 billion |
| Expected Cost Synergies | Approximately $600 million |
| Pro Forma Ownership (AkzoNobel/Axalta) | 55% / 45% |
| Expected Closing Timeline | Late 2026 to early 2027 |
Still, Axalta Coating Systems Ltd. is fighting to compete beyond just price, which is smart given the market structure. The company differentiates through innovation, for example, with its collaboration with Dürr on digital paint technology, aiming to offer superior application and process benefits to customers. This focus on technology helps maintain its leadership position in certain niches; Axalta is the market leader in the global refinish coatings industry, holding a market share of approximately 35%.
The effectiveness of Axalta Coating Systems Ltd.'s current competitive positioning is signaled by its strong profitability, even while navigating softer demand in areas like North American Performance Coatings. You see this clearly in the Q3 2025 results, which marked the twelfth consecutive quarter of Adjusted EBITDA and Adjusted EBITDA margin growth year-over-year. That operational discipline is key when facing down the competition.
Check out the segment profitability from that quarter:
- Performance Coatings Adjusted EBITDA Margin: 25.5%
- Mobility Coatings Adjusted EBITDA Margin: 18.0%
- Consolidated Adjusted EBITDA Margin (Q3 2025): 22.8%
That consolidated 22.8% Adjusted EBITDA margin in Q3 2025, on record Adjusted EBITDA of $294 million, shows the company is executing well on cost control while the merger is pending.
Axalta Coating Systems Ltd. (AXTA) - Porter's Five Forces: Threat of substitutes
You're assessing the competitive landscape for Axalta Coating Systems Ltd. (AXTA) as of late 2025, and the threat from substitute products is definitely a major factor shaping strategy. This force looks at what else a customer could use instead of Axalta's core offerings, which are high-performance liquid and powder coatings.
The primary substitution threat is the shift to new coating technologies like waterborne or powder coatings. This isn't a future risk; it's happening now, driven by environmental mandates and customer preference for lower-impact solutions. For instance, the global waterborne automobile coating market is already valued at USD 7.5 billion in 2025, with projections to hit USD 13.4 billion by 2035 at a 6.0% CAGR. Similarly, powder coatings, which are inherently VOC-free, represent a significant alternative, with the global market expected to grow from USD 15.17 billion in 2024 to USD 20.87 billion by 2030.
Regulatory and customer demand for eco-friendly, low-VOC (Volatile Organic Compound) products drives substitution pressure across the board. The global coatings industry is reacting to rules like the U.S. EPA's January 2025 update to National VOC Emission Standards for Aerosol Coatings, which tightened ozone controls. This regulatory tightening means that traditional solvent-borne coatings are seeing slower growth compared to their low-VOC counterparts.
Here's a quick look at the market dynamics for these key substitutes, showing where the volume and value are shifting:
| Coating Technology Segment | Market Value (2025 Estimate) | Forecast CAGR (to 2030/2035) | Key Driver |
|---|---|---|---|
| Global Waterborne Automobile Coatings | USD 7.5 billion | 6.0% (to 2035) | Environmental regulations, sustainability demand |
| Global Powder Coatings | N/A (Value in 2024: USD 15.17 billion) | 5.46% (to 2030) | Eco-friendliness, high durability |
Alternative materials in vehicle manufacturing, such as advanced plastics, could also reduce the need for traditional coatings in certain applications, though the extent of this substitution is not fully quantified in recent reports. Still, the need for protection remains, just with different material requirements.
Axalta mitigates this by leading in sustainable solutions, especially for Electric Vehicle (EV) manufacturers. The company has already developed and commercialized sustainable coating solutions specifically for EV makers. This proactive approach positions Axalta to capture growth in the EV segment, where powder coatings, for example, offer dielectric benefits for battery manufacturers. For context, Axalta Coating Systems Ltd. reported trailing twelve-month revenue of $5.166B as of September 30, 2025.
The high performance requirements (corrosion, durability) in automotive and industrial markets limit easy material substitution. While the type of coating (waterborne vs. solvent) is changing rapidly, substituting the function of a high-performance coating-like the corrosion resistance needed for industrial machinery or the durability required for automotive clearcoats-is much harder. The market is moving toward higher-value products that offer superior performance alongside sustainability, which helps anchor demand for premium suppliers like Axalta Coating Systems Ltd..
Finance: review Q3 2025 working capital impact from any raw material substitution costs by next Tuesday.
Axalta Coating Systems Ltd. (AXTA) - Porter's Five Forces: Threat of new entrants
You're looking at the barriers to entry for a new coatings player trying to break into Axalta Coating Systems Ltd.'s market as of late 2025. Honestly, the hurdles are substantial, mostly due to the sheer scale and sunk costs required to even start.
High capital expenditure is a defintely significant barrier; Axalta plans $180 million in CapEx for fiscal year 2025 alone to maintain and grow its operations. This level of investment right out of the gate is tough for most newcomers to match. Plus, you can't just start selling tomorrow; new entrants face high R&D costs for product development and navigating complex regulatory compliance, like ever-tightening environmental standards.
For context on the required scale, consider these operational and financial benchmarks:
| Barrier Metric | Axalta Coating Systems Ltd. Data Point | Relevance to New Entrants |
|---|---|---|
| Planned FY2025 Capital Expenditure | $180 million | Initial investment hurdle for facilities and equipment. |
| R&D Expenses (TTM Sep 30, 2025) | $74 million | Cost to develop compliant, high-performance formulations. |
| Global Reach | Serves customers in over 140 countries | Requires an immediate, massive global logistics footprint. |
| Gross Margin (FY2025 Estimate) | 34.61% | New players must achieve similar efficiency quickly to price competitively. |
| Debt-to-Equity Ratio | 1.51 | Indicates the high leverage common in established, capital-intensive players. |
Establishing a global manufacturing and distribution network across over 140 countries is prohibitive for a startup. You need that footprint to service global customers effectively. Existing players benefit from established customer relationships and long-term OEM qualification processes, which are not quick to build. Axalta Coating Systems Ltd. supports over 220 assembly plants worldwide, including all top ten global automotive manufacturers. For refinish, for example, technician certification often requires renewal every two years, locking in existing supplier relationships.
The industry structure itself pushes the required scale higher. The industry is already undergoing consolidation; the announcement in November 2025 that Axalta Coating Systems Ltd. would merge with AkzoNobel signals that the remaining giants are getting bigger. This merger activity increases the minimum scale required to compete effectively on a global stage, making the threat from new, small entrants relatively low.
Key barriers to entry include:
- Capital Intensity: Axalta's planned $180 million CapEx for 2025 sets a high bar.
- R&D/Compliance Costs: TTM R&D expenses through September 30, 2025, were $74 million.
- Global Footprint: Serving over 140 countries demands prohibitive logistics infrastructure.
- Customer Lock-in: Long-term OEM qualification processes create sticky relationships.
- Industry Consolidation: The announced merger between Axalta Coating Systems Ltd. and AkzoNobel raises the competitive scale bar.
Disclaimer
All information, articles, and product details provided on this website are for general informational and educational purposes only. We do not claim any ownership over, nor do we intend to infringe upon, any trademarks, copyrights, logos, brand names, or other intellectual property mentioned or depicted on this site. Such intellectual property remains the property of its respective owners, and any references here are made solely for identification or informational purposes, without implying any affiliation, endorsement, or partnership.
We make no representations or warranties, express or implied, regarding the accuracy, completeness, or suitability of any content or products presented. Nothing on this website should be construed as legal, tax, investment, financial, medical, or other professional advice. In addition, no part of this site—including articles or product references—constitutes a solicitation, recommendation, endorsement, advertisement, or offer to buy or sell any securities, franchises, or other financial instruments, particularly in jurisdictions where such activity would be unlawful.
All content is of a general nature and may not address the specific circumstances of any individual or entity. It is not a substitute for professional advice or services. Any actions you take based on the information provided here are strictly at your own risk. You accept full responsibility for any decisions or outcomes arising from your use of this website and agree to release us from any liability in connection with your use of, or reliance upon, the content or products found herein.