
|
Balkrishna Industries Limited (Balkrisind.NS) Avaliação DCF |
Totalmente Editável: Adapte-Se Às Suas Necessidades No Excel Ou Planilhas
Design Profissional: Modelos Confiáveis E Padrão Da Indústria
Pré-Construídos Para Uso Rápido E Eficiente
Compatível com MAC/PC, totalmente desbloqueado
Não É Necessária Experiência; Fácil De Seguir
Balkrishna Industries Limited (BALKRISIND.NS) Bundle
Descubra o verdadeiro potencial da Balkrishna Industries Limited (Balkrisindns) com nossa calculadora avançada de DCF! Ajustar suposições cruciais, explorar vários cenários e avaliar como as mudanças influenciam a avaliação da Balkrishna Industries Limited (Balkrisindns) - tudo dentro de um único modelo do Excel.
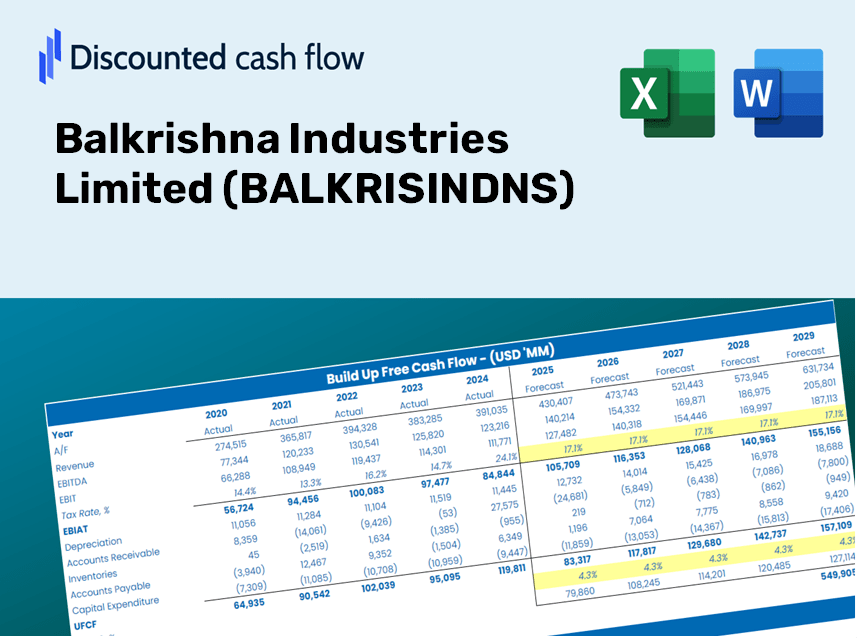
Discounted Cash Flow (DCF) - (USD MM)
| Year | AY1 2021 |
AY2 2022 |
AY3 2023 |
AY4 2024 |
AY5 2025 |
FY1 2026 |
FY2 2027 |
FY3 2028 |
FY4 2029 |
FY5 2030 |
|---|---|---|---|---|---|---|---|---|---|---|
| Revenue | 56,758.0 | 82,131.0 | 96,550.2 | 93,043.7 | 104,469.5 | 122,988.9 | 144,791.3 | 170,458.6 | 200,676.0 | 236,250.0 |
| Revenue Growth, % | 0 | 44.7 | 17.56 | -3.63 | 12.28 | 17.73 | 17.73 | 17.73 | 17.73 | 17.73 |
| EBITDA | 19,813.6 | 24,450.7 | 20,488.2 | 26,932.3 | 24,576.0 | 34,035.9 | 40,069.5 | 47,172.7 | 55,535.1 | 65,379.8 |
| EBITDA, % | 34.91 | 29.77 | 21.22 | 28.95 | 23.52 | 27.67 | 27.67 | 27.67 | 27.67 | 27.67 |
| Depreciation | 4,146.8 | 4,537.7 | 5,693.7 | 6,507.2 | 6,806.6 | 7,929.7 | 9,335.4 | 10,990.2 | 12,938.5 | 15,232.1 |
| Depreciation, % | 7.31 | 5.52 | 5.9 | 6.99 | 6.52 | 6.45 | 6.45 | 6.45 | 6.45 | 6.45 |
| EBIT | 15,666.8 | 19,913.0 | 14,794.5 | 20,425.1 | 17,769.4 | 26,106.3 | 30,734.2 | 36,182.5 | 42,596.6 | 50,147.7 |
| EBIT, % | 27.6 | 24.25 | 15.32 | 21.95 | 17.01 | 21.23 | 21.23 | 21.23 | 21.23 | 21.23 |
| Total Cash | 4,469.5 | 7,304.4 | 8,439.0 | 14,236.1 | 17,830.2 | 14,236.4 | 16,760.1 | 19,731.1 | 23,228.9 | 27,346.7 |
| Total Cash, percent | .0 | .0 | .0 | .0 | .0 | .0 | .0 | .0 | .0 | .0 |
| Account Receivables | 7,535.9 | 10,961.5 | 11,152.7 | 16,149.1 | 15,194.7 | 17,237.1 | 20,292.8 | 23,890.1 | 28,125.1 | 33,110.9 |
| Account Receivables, % | 13.28 | 13.35 | 11.55 | 17.36 | 14.54 | 14.02 | 14.02 | 14.02 | 14.02 | 14.02 |
| Inventories | 9,397.2 | 16,720.9 | 16,673.7 | 13,315.3 | 17,819.3 | 21,044.1 | 24,774.6 | 29,166.4 | 34,336.7 | 40,423.6 |
| Inventories, % | 16.56 | 20.36 | 17.27 | 14.31 | 17.06 | 17.11 | 17.11 | 17.11 | 17.11 | 17.11 |
| Accounts Payable | 6,550.2 | 8,292.6 | 4,921.4 | 9,102.3 | 7,539.3 | 10,757.6 | 12,664.7 | 14,909.7 | 17,552.8 | 20,664.4 |
| Accounts Payable, % | 11.54 | 10.1 | 5.1 | 9.78 | 7.22 | 8.75 | 8.75 | 8.75 | 8.75 | 8.75 |
| Capital Expenditure | -9,262.2 | -15,952.9 | -17,624.7 | -10,985.5 | -14,830.0 | -19,678.0 | -23,166.4 | -27,273.1 | -32,107.9 | -37,799.7 |
| Capital Expenditure, % | -16.32 | -19.42 | -18.25 | -11.81 | -14.2 | -16 | -16 | -16 | -16 | -16 |
| Tax Rate, % | 24.34 | 24.34 | 24.34 | 24.34 | 24.34 | 24.34 | 24.34 | 24.34 | 24.34 | 24.34 |
| EBITAT | 11,864.4 | 14,420.1 | 10,903.1 | 15,484.5 | 13,444.2 | 19,491.6 | 22,946.9 | 27,014.7 | 31,803.6 | 37,441.5 |
| Depreciation | ||||||||||
| Changes in Account Receivables | ||||||||||
| Changes in Inventories | ||||||||||
| Changes in Accounts Payable | ||||||||||
| Capital Expenditure | ||||||||||
| UFCF | -3,633.9 | -6,002.0 | -4,543.1 | 13,549.1 | 308.2 | 5,694.4 | 4,236.7 | 4,987.7 | 5,871.9 | 6,912.8 |
| WACC, % | 5.44 | 5.44 | 5.44 | 5.45 | 5.44 | 5.44 | 5.44 | 5.44 | 5.44 | 5.44 |
| PV UFCF | ||||||||||
| SUM PV UFCF | 23,519.9 | |||||||||
| Long Term Growth Rate, % | 4.00 | |||||||||
| Free cash flow (T + 1) | 7,189 | |||||||||
| Terminal Value | 498,547 | |||||||||
| Present Terminal Value | 382,504 | |||||||||
| Enterprise Value | 406,024 | |||||||||
| Net Debt | 31,812 | |||||||||
| Equity Value | 374,212 | |||||||||
| Diluted Shares Outstanding, MM | 193 | |||||||||
| Equity Value Per Share | 1,935.77 |
What You Will Receive
- Customizable Excel Template: A fully editable Excel-based DCF Calculator featuring pre-loaded financial data for BALKRISINDNS.
- Accurate Data: Access to historical figures and future projections (indicated in the highlighted cells).
- Flexible Forecasting: Modify assumptions regarding revenue growth, EBITDA percentage, and WACC.
- Instant Calculations: See real-time effects of your inputs on the valuation of Balkrishna Industries Limited.
- Professional Resource: Designed for investors, CFOs, consultants, and financial analysts.
- User-Friendly Interface: Organized for simplicity and ease of navigation, complete with step-by-step guidance.
Key Features
- Customizable Forecast Inputs: Adjust essential parameters such as revenue growth, EBITDA %, and capital expenditures tailored to Balkrishna Industries Limited (BALKRISINDNS).
- Instant DCF Valuation: Quickly generates intrinsic value, NPV, and various other financial metrics.
- High-Precision Accuracy: Leverages real-world financial data from Balkrishna Industries for reliable valuation results.
- Effortless Scenario Analysis: Easily explore alternative assumptions and assess their impact on outcomes.
- Efficiency-Boosting Tool: Remove the hassle of constructing complex valuation models from the ground up.
How It Works
- Step 1: Download the prebuilt Excel template featuring Balkrishna Industries Limited (BALKRISINDNS) data.
- Step 2: Explore the filled-in sheets to familiarize yourself with the key performance indicators.
- Step 3: Modify the forecasts and assumptions in the editable yellow cells (WACC, growth, margins).
- Step 4: Instantly see the recalculated results, including the intrinsic value of Balkrishna Industries Limited (BALKRISINDNS).
- Step 5: Make well-informed investment decisions or create reports based on the generated outputs.
Why Choose This Calculator for Balkrishna Industries Limited (BALKRISINDNS)?
- User-Friendly Interface: Crafted for both novices and seasoned professionals.
- Customizable Inputs: Easily adjust parameters to suit your specific analysis.
- Real-Time Feedback: Observe immediate updates to Balkrishna Industries’ valuation as you change inputs.
- Preloaded Data: Comes with Balkrishna Industries’ actual financial figures for swift evaluations.
- Preferred by Experts: Utilized by investors and analysts for making well-informed choices.
Who Is This Product Ideal For?
- Individual Investors: Make well-informed choices regarding buying or selling Balkrishna Industries Limited (BALKRISINDNS) stock.
- Financial Analysts: Enhance valuation processes with pre-built financial models specific to Balkrishna Industries Limited.
- Consultants: Provide clients with accurate and timely valuation insights into Balkrishna Industries Limited.
- Business Owners: Gain insights into how companies like Balkrishna Industries Limited are valued to inform your own business strategy.
- Finance Students: Acquire valuation skills using real-world data and case studies related to Balkrishna Industries Limited.
Contents of the Template
- Pre-Filled Data: Contains historical financials and projections for Balkrishna Industries Limited (BALKRISINDNS).
- Discounted Cash Flow Model: An editable DCF valuation model featuring automatic calculations.
- Weighted Average Cost of Capital (WACC): A separate sheet designed for WACC calculations based on user-defined inputs.
- Key Financial Ratios: Assess the profitability, efficiency, and leverage of Balkrishna Industries Limited (BALKRISINDNS).
- Customizable Inputs: Easily modify revenue growth, margins, and tax rates according to your analysis.
- Comprehensive Dashboard: Visual representations and tables summarizing essential valuation outcomes.
Disclaimer
All information, articles, and product details provided on this website are for general informational and educational purposes only. We do not claim any ownership over, nor do we intend to infringe upon, any trademarks, copyrights, logos, brand names, or other intellectual property mentioned or depicted on this site. Such intellectual property remains the property of its respective owners, and any references here are made solely for identification or informational purposes, without implying any affiliation, endorsement, or partnership.
We make no representations or warranties, express or implied, regarding the accuracy, completeness, or suitability of any content or products presented. Nothing on this website should be construed as legal, tax, investment, financial, medical, or other professional advice. In addition, no part of this site—including articles or product references—constitutes a solicitation, recommendation, endorsement, advertisement, or offer to buy or sell any securities, franchises, or other financial instruments, particularly in jurisdictions where such activity would be unlawful.
All content is of a general nature and may not address the specific circumstances of any individual or entity. It is not a substitute for professional advice or services. Any actions you take based on the information provided here are strictly at your own risk. You accept full responsibility for any decisions or outcomes arising from your use of this website and agree to release us from any liability in connection with your use of, or reliance upon, the content or products found herein.