
|
Avaliação DCF da Corporação de Oil Batalhão (BATL) |
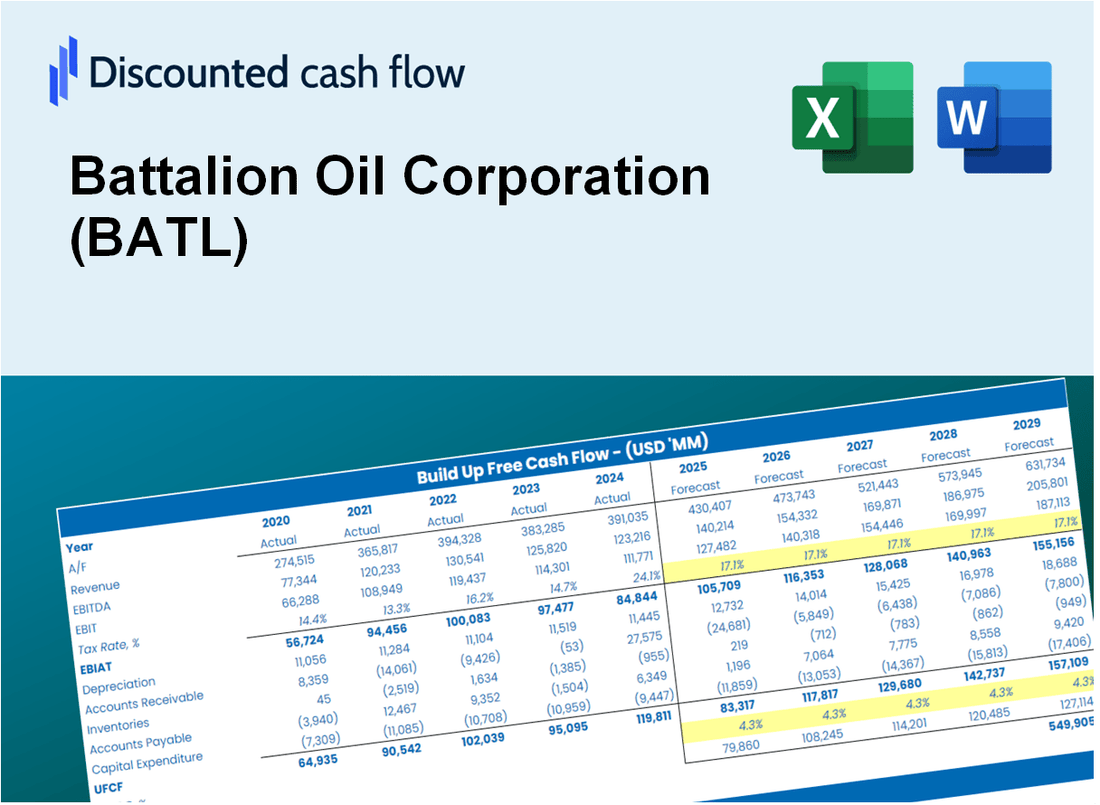
Totalmente Editável: Adapte-Se Às Suas Necessidades No Excel Ou Planilhas
Design Profissional: Modelos Confiáveis E Padrão Da Indústria
Pré-Construídos Para Uso Rápido E Eficiente
Compatível com MAC/PC, totalmente desbloqueado
Não É Necessária Experiência; Fácil De Seguir
Battalion Oil Corporation (BATL) Bundle
Simplifique sua análise e melhore a precisão com a nossa calculadora DCF (BATL)! Utilizando dados reais da corporação de petróleo do batalhão e suposições personalizáveis, essa ferramenta permite que você preveja, analise e valorse (BATL), assim como um investidor experiente.
What You Will Get
- Comprehensive BATL Financials: Access to historical and projected data for precise valuation.
- Customizable Inputs: Adjust WACC, tax rates, revenue growth, and capital expenditures as needed.
- Real-Time Calculations: Intrinsic value and NPV are computed automatically.
- Scenario Analysis: Explore various scenarios to assess Battalion Oil Corporation’s future performance.
- User-Friendly Design: Crafted for industry professionals while remaining approachable for newcomers.
Key Features
- Customizable Financial Inputs: Adjust vital metrics such as production rates, operating costs, and capital investments.
- Instant DCF Valuation: Provides quick calculations for intrinsic value, NPV, and other financial metrics.
- High-Precision Accuracy: Leverages Battalion Oil Corporation's (BATL) actual financial data for dependable valuation results.
- Simplified Scenario Analysis: Easily evaluate various assumptions and analyze different outcomes.
- Efficiency Booster: Streamlines the valuation process, eliminating the need for intricate model construction.
How It Works
- Step 1: Download the Excel file.
- Step 2: Review Battalion Oil Corporation’s pre-filled financial data and forecasts.
- Step 3: Modify critical inputs like revenue growth, WACC, and tax rates (highlighted cells).
- Step 4: Watch the DCF model update instantly as you tweak assumptions.
- Step 5: Analyze the outputs and use the results for investment decisions.
Why Choose This Calculator for Battalion Oil Corporation (BATL)?
- Accuracy: Leverage real Battalion Oil financials for precise data.
- Flexibility: Tailored for users to easily adjust and experiment with inputs.
- Time-Saving: Eliminate the need to construct a DCF model from the ground up.
- Professional-Grade: Crafted with the precision and usability expected at the CFO level.
- User-Friendly: Intuitive design that accommodates users without extensive financial modeling expertise.
Who Should Use Battalion Oil Corporation (BATL)?
- Investors: Gain insights and make informed decisions with a reliable investment platform.
- Financial Analysts: Streamline your analysis with comprehensive data and tools tailored for the oil industry.
- Consultants: Easily modify resources for client engagements or strategic reports.
- Energy Sector Enthusiasts: Enhance your knowledge of the oil market with real-time data and case studies.
- Educators and Students: Utilize it as a hands-on resource for courses focused on energy economics and finance.
What the Template Contains
- Preloaded BATL Data: Historical and projected financial data, including revenue, EBIT, and capital expenditures.
- DCF and WACC Models: Professional-grade sheets for calculating intrinsic value and Weighted Average Cost of Capital.
- Editable Inputs: Yellow-highlighted cells for adjusting revenue growth, tax rates, and discount rates.
- Financial Statements: Comprehensive annual and quarterly financials for deeper analysis.
- Key Ratios: Profitability, leverage, and efficiency ratios to evaluate performance.
- Dashboard and Charts: Visual summaries of valuation outcomes and assumptions.
Disclaimer
All information, articles, and product details provided on this website are for general informational and educational purposes only. We do not claim any ownership over, nor do we intend to infringe upon, any trademarks, copyrights, logos, brand names, or other intellectual property mentioned or depicted on this site. Such intellectual property remains the property of its respective owners, and any references here are made solely for identification or informational purposes, without implying any affiliation, endorsement, or partnership.
We make no representations or warranties, express or implied, regarding the accuracy, completeness, or suitability of any content or products presented. Nothing on this website should be construed as legal, tax, investment, financial, medical, or other professional advice. In addition, no part of this site—including articles or product references—constitutes a solicitation, recommendation, endorsement, advertisement, or offer to buy or sell any securities, franchises, or other financial instruments, particularly in jurisdictions where such activity would be unlawful.
All content is of a general nature and may not address the specific circumstances of any individual or entity. It is not a substitute for professional advice or services. Any actions you take based on the information provided here are strictly at your own risk. You accept full responsibility for any decisions or outcomes arising from your use of this website and agree to release us from any liability in connection with your use of, or reliance upon, the content or products found herein.