
|
Black Diamond Therapeutics, Inc. (BDTX) Avaliação DCF |
Totalmente Editável: Adapte-Se Às Suas Necessidades No Excel Ou Planilhas
Design Profissional: Modelos Confiáveis E Padrão Da Indústria
Pré-Construídos Para Uso Rápido E Eficiente
Compatível com MAC/PC, totalmente desbloqueado
Não É Necessária Experiência; Fácil De Seguir
Black Diamond Therapeutics, Inc. (BDTX) Bundle
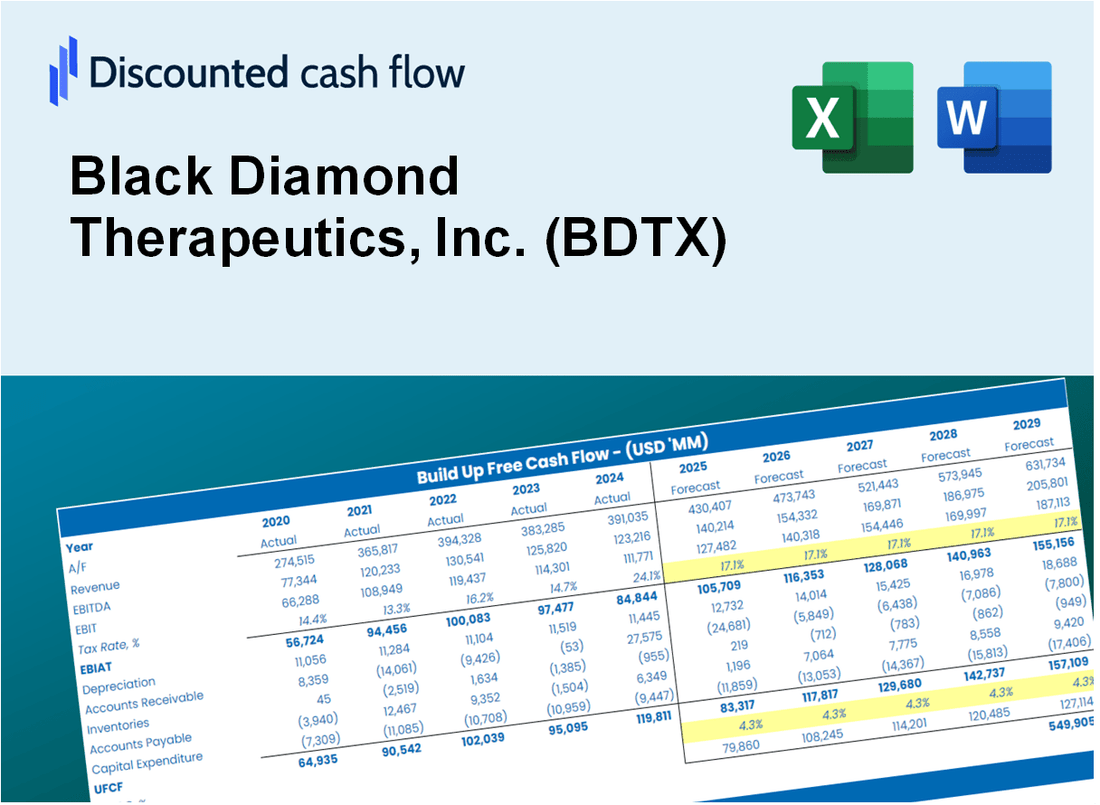
Projetado para precisão, nossa calculadora DCF (BDTX) permite avaliar a avaliação da Black Diamond Therapeutics, Inc. usando dados financeiros do mundo real e fornece flexibilidade completa para modificar todos os parâmetros-chave para projeções aprimoradas.
Discounted Cash Flow (DCF) - (USD MM)
| Year | AY1 2020 |
AY2 2021 |
AY3 2022 |
AY4 2023 |
AY5 2024 |
FY1 2025 |
FY2 2026 |
FY3 2027 |
FY4 2028 |
FY5 2029 |
|---|---|---|---|---|---|---|---|---|---|---|
| Revenue | .0 | .0 | .0 | .0 | .0 | .0 | .0 | .0 | .0 | .0 |
| Revenue Growth, % | 0 | 0 | 0 | 0 | 0 | 0 | 0 | 0 | 0 | 0 |
| EBITDA | -66.7 | -126.7 | -92.3 | -86.0 | -78.4 | .0 | .0 | .0 | .0 | .0 |
| EBITDA, % | 100 | 100 | 100 | 100 | 100 | 100 | 100 | 100 | 100 | 100 |
| Depreciation | .6 | .2 | .5 | .4 | .3 | .0 | .0 | .0 | .0 | .0 |
| Depreciation, % | 100 | 100 | 100 | 100 | 100 | 100 | 100 | 100 | 100 | 100 |
| EBIT | -67.3 | -126.9 | -92.8 | -86.5 | -78.8 | .0 | .0 | .0 | .0 | .0 |
| EBIT, % | 100 | 100 | 100 | 100 | 100 | 100 | 100 | 100 | 100 | 100 |
| Total Cash | 315.1 | 209.8 | 122.8 | 131.4 | 98.6 | .0 | .0 | .0 | .0 | .0 |
| Total Cash, percent | .0 | .0 | .0 | .0 | .0 | .0 | .0 | .0 | .0 | .0 |
| Account Receivables | .0 | .0 | .0 | .0 | .0 | .0 | .0 | .0 | .0 | .0 |
| Account Receivables, % | 100 | 100 | 100 | 100 | 100 | 100 | 100 | 100 | 100 | 100 |
| Inventories | .0 | .0 | .0 | .0 | .0 | .0 | .0 | .0 | .0 | .0 |
| Inventories, % | 100 | 100 | 100 | 100 | 100 | 100 | 100 | 100 | 100 | 100 |
| Accounts Payable | 2.5 | 4.1 | 1.9 | 2.3 | 4.0 | .0 | .0 | .0 | .0 | .0 |
| Accounts Payable, % | 100 | 100 | 100 | 100 | 100 | 100 | 100 | 100 | 100 | 100 |
| Capital Expenditure | -.1 | -2.7 | -.2 | .0 | .0 | .0 | .0 | .0 | .0 | .0 |
| Capital Expenditure, % | 100 | 100 | 100 | 100 | 100 | 0 | 0 | 0 | 0 | 0 |
| Tax Rate, % | 0 | 0 | 0 | 0 | 0 | 0 | 0 | 0 | 0 | 0 |
| EBITAT | -67.3 | -126.9 | -92.8 | -86.5 | -78.8 | .0 | .0 | .0 | .0 | .0 |
| Depreciation | ||||||||||
| Changes in Account Receivables | ||||||||||
| Changes in Inventories | ||||||||||
| Changes in Accounts Payable | ||||||||||
| Capital Expenditure | ||||||||||
| UFCF | -64.3 | -127.8 | -94.7 | -85.6 | -76.8 | -4.0 | .0 | .0 | .0 | .0 |
| WACC, % | 18.07 | 18.07 | 18.07 | 18.07 | 18.07 | 18.07 | 18.07 | 18.07 | 18.07 | 18.07 |
| PV UFCF | ||||||||||
| SUM PV UFCF | -3.4 | |||||||||
| Long Term Growth Rate, % | 2.00 | |||||||||
| Free cash flow (T + 1) | 0 | |||||||||
| Terminal Value | 0 | |||||||||
| Present Terminal Value | 0 | |||||||||
| Enterprise Value | -3 | |||||||||
| Net Debt | -14 | |||||||||
| Equity Value | 11 | |||||||||
| Diluted Shares Outstanding, MM | 55 | |||||||||
| Equity Value Per Share | 0.20 |
What You Will Get
- Real BDTX Financial Data: Pre-filled with Black Diamond Therapeutics’ historical and projected data for precise analysis.
- Fully Editable Template: Modify key inputs like revenue growth, WACC, and EBITDA % with ease.
- Automatic Calculations: See Black Diamond Therapeutics’ intrinsic value update instantly based on your changes.
- Professional Valuation Tool: Designed for investors, analysts, and consultants seeking accurate DCF results.
- User-Friendly Design: Simple structure and clear instructions for all experience levels.
Key Features
- Customizable Clinical Parameters: Adjust vital inputs such as patient demographics, treatment efficacy, and trial duration.
- Instant DCF Analysis: Provides real-time calculations for intrinsic value, NPV, and additional financial metrics.
- Industry-Leading Precision: Leverages Black Diamond Therapeutics' (BDTX) actual financial data for accurate valuation results.
- Simplified Scenario Testing: Easily explore various assumptions and assess different outcomes.
- Efficiency Booster: Avoid the hassle of constructing intricate valuation models from the ground up.
How It Works
- Download the Template: Gain immediate access to the Excel-based BDTX DCF Calculator.
- Input Your Assumptions: Modify the yellow-highlighted cells for growth rates, WACC, margins, and other key metrics.
- Instant Calculations: The model will automatically refresh to reflect Black Diamond Therapeutics’ intrinsic value.
- Test Scenarios: Experiment with various assumptions to assess potential changes in valuation.
- Analyze and Decide: Leverage the outcomes to inform your investment or financial analysis.
Why Choose Black Diamond Therapeutics, Inc. (BDTX)?
- Innovative Solutions: Cutting-edge therapies that target genetic drivers of disease.
- Scientific Expertise: Backed by a team of leading scientists and researchers in the field.
- Patient-Centric Approach: Focused on developing treatments that improve patient outcomes.
- Strong Pipeline: Robust portfolio of drug candidates in various stages of development.
- Proven Track Record: Committed to delivering results that meet the highest standards of quality.
Who Should Use This Product?
- Pharmaceutical Students: Explore drug development processes and apply them using real-world data.
- Researchers: Integrate cutting-edge models into studies or academic projects.
- Investors: Evaluate your investment strategies and assess the potential of Black Diamond Therapeutics, Inc. (BDTX).
- Market Analysts: Enhance your analysis with a customizable financial model tailored for biotech companies.
- Healthcare Entrepreneurs: Understand how biotech firms like Black Diamond Therapeutics, Inc. (BDTX) are evaluated in the market.
What the Template Contains
- Preloaded BDTX Data: Historical and projected financial data, including revenue, EBIT, and capital expenditures.
- DCF and WACC Models: Professional-grade sheets for calculating intrinsic value and Weighted Average Cost of Capital.
- Editable Inputs: Yellow-highlighted cells for adjusting revenue growth, tax rates, and discount rates.
- Financial Statements: Comprehensive annual and quarterly financials for deeper analysis.
- Key Ratios: Profitability, leverage, and efficiency ratios to evaluate performance.
- Dashboard and Charts: Visual summaries of valuation outcomes and assumptions.
Disclaimer
All information, articles, and product details provided on this website are for general informational and educational purposes only. We do not claim any ownership over, nor do we intend to infringe upon, any trademarks, copyrights, logos, brand names, or other intellectual property mentioned or depicted on this site. Such intellectual property remains the property of its respective owners, and any references here are made solely for identification or informational purposes, without implying any affiliation, endorsement, or partnership.
We make no representations or warranties, express or implied, regarding the accuracy, completeness, or suitability of any content or products presented. Nothing on this website should be construed as legal, tax, investment, financial, medical, or other professional advice. In addition, no part of this site—including articles or product references—constitutes a solicitation, recommendation, endorsement, advertisement, or offer to buy or sell any securities, franchises, or other financial instruments, particularly in jurisdictions where such activity would be unlawful.
All content is of a general nature and may not address the specific circumstances of any individual or entity. It is not a substitute for professional advice or services. Any actions you take based on the information provided here are strictly at your own risk. You accept full responsibility for any decisions or outcomes arising from your use of this website and agree to release us from any liability in connection with your use of, or reliance upon, the content or products found herein.