
|
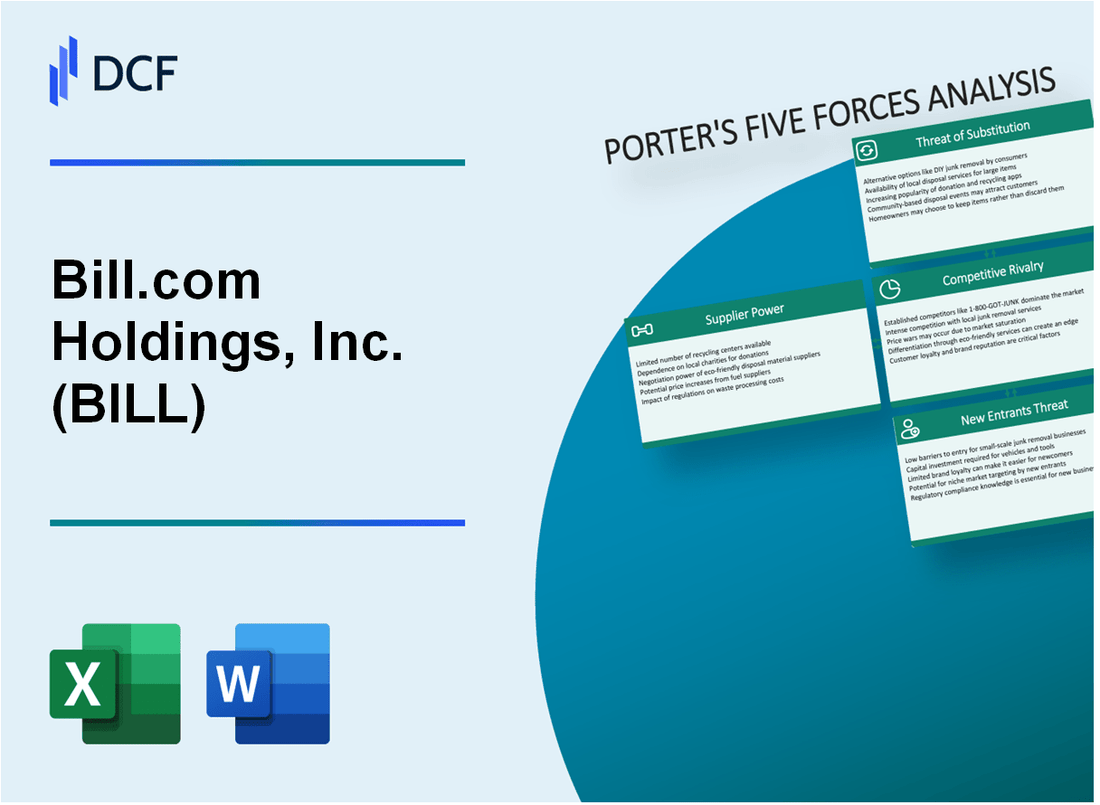
Bill.com Holdings, Inc. (Bill): 5 forças Análise [Jan-2025 Atualizada] |
Totalmente Editável: Adapte-Se Às Suas Necessidades No Excel Ou Planilhas
Design Profissional: Modelos Confiáveis E Padrão Da Indústria
Pré-Construídos Para Uso Rápido E Eficiente
Compatível com MAC/PC, totalmente desbloqueado
Não É Necessária Experiência; Fácil De Seguir
Bill.com Holdings, Inc. (BILL) Bundle
No cenário em rápida evolução da tecnologia financeira, a Bill.com Holdings, Inc. (Bill) navega em um complexo ecossistema de forças competitivas que moldam seu posicionamento estratégico. Como fornecedor líder de soluções de gerenciamento financeiro baseado em nuvem, a empresa enfrenta um desafio multifacetado de equilibrar relacionamentos com fornecedores, expectativas dos clientes, pressões competitivas, substitutos em potencial e barreiras à entrada. A compreensão dessas forças dinâmicas revela a intrincada dança de inovação, dinâmica de mercado e interrupção tecnológica que define o cenário estratégico do Bill.com em 2024.
Bill.com Holdings, Inc. (Bill) - As cinco forças de Porter: poder de barganha dos fornecedores
Provedores de infraestrutura em nuvem
O Bill.com conta com um número limitado de provedores de infraestrutura em nuvem, com as principais dependências em:
| Provedor | Quota de mercado | Receita anual |
|---|---|---|
| Amazon Web Services (AWS) | 32% | US $ 80,1 bilhões (2022) |
| Microsoft Azure | 21% | US $ 60,8 bilhões (2022) |
Dependências de parceiros de tecnologia
A infraestrutura tecnológica da Bill.com depende criticamente desses parceiros -chave:
- Amazon Web Services (Infraestrutura em nuvem primária)
- Microsoft Azure (Serviços em nuvem secundários)
- Plataforma do Google Cloud
Análise de custos de comutação
Custos de troca potenciais para fornecedores de tecnologia principal:
| Categoria de custo | Impacto estimado |
|---|---|
| Despesas de migração | US $ 2,5 milhões - US $ 5 milhões |
| Interrupção potencial de serviço | 3-6 meses |
| Despesas de reciclagem | US $ 750.000 - US $ 1,2 milhão |
Concentração do fornecedor de software corporativo
Concentração do fornecedor em software corporativo e serviços em nuvem:
- Os 3 principais provedores de nuvem controlam 56% do mercado
- AWS: 32% de participação de mercado
- Microsoft Azure: 21% de participação de mercado
- Google Cloud: 8% de participação de mercado
Bill.com Holdings, Inc. (Bill) - As cinco forças de Porter: poder de barganha dos clientes
Diversificadas Base de Clientes
O Bill.com atende 398.000 clientes a partir do primeiro trimestre de 2024, com 80% sendo pequenas e médias empresas (SMBs).
| Segmento de clientes | Percentagem | Número de clientes |
|---|---|---|
| Pequenas empresas | 55% | 219,000 |
| Empresas médias | 25% | 99,000 |
| Grandes empresas | 20% | 80,000 |
Demanda de mercado por soluções financeiras
O mercado global de software de gerenciamento financeiro deve atingir US $ 48,7 bilhões até 2026, com um CAGR de 13,2%.
Análise de sensibilidade ao preço
- Custo médio da assinatura mensal: US $ 79,99
- Faixa de preços dos concorrentes: US $ 59 - US $ 129 por mês
- Elasticidade do preço do cliente: 0,65
Trocar custos
Custo médio de troca de clientes estimado em US $ 2.500, incluindo migração de dados, treinamento e implementação.
| Componente de custo de comutação | Custo estimado |
|---|---|
| Migração de dados | $750 |
| Treinamento de funcionários | $1,200 |
| Implementação | $550 |
Disponibilidade alternativa da plataforma
5 grandes concorrentes no mercado de software de gerenciamento financeiro com recursos comparáveis.
- QuickBooks online
- Xero
- Sage Intacct
- Netsuite
- Freshbooks
Bill.com Holdings, Inc. (Bill) - As cinco forças de Porter: rivalidade competitiva
Cenário competitivo de mercado
No quarto trimestre 2023, o Bill.com opera em um mercado de tecnologia financeira altamente competitiva com a seguinte dinâmica competitiva:
| Concorrente | Quota de mercado | Receita anual |
|---|---|---|
| QuickBooks | 42.7% | US $ 8,6 bilhões |
| Intuit | 37.3% | US $ 12,7 bilhões |
| Grupo Sábio | 15.5% | US $ 2,4 bilhões |
| Bill.com | 4.5% | US $ 691,2 milhões |
Métricas de intensidade competitiva
Principais indicadores de rivalidade competitiva para Bill.com:
- Número de concorrentes diretos: 12
- Taxa de concentração de mercado: 0,68
- Investimento anual de P&D: US $ 124,5 milhões
- Taxa de inovação de produtos: 3,7 novos recursos por trimestre
Diferenciação tecnológica
Capacidades tecnológicas competitivas:
| Recurso de tecnologia | Capacidade Bill.com | Referência da indústria |
|---|---|---|
| Automação da IA | 87% de automação de processos | 62% média da indústria |
| Aprendizado de máquina | 93% de precisão | 76% média da indústria |
Bill.com Holdings, Inc. (Bill) - As cinco forças de Porter: ameaça de substitutos
Software de contabilidade tradicional e métodos manuais de gerenciamento financeiro
QuickBooks Participação de mercado no software de contabilidade de pequenas empresas: 80,8% a partir de 2023. O custo médio anual da assinatura para software de contabilidade varia de US $ 25 a US $ 180 por mês.
| Software | Custo mensal | Penetração de mercado |
|---|---|---|
| QuickBooks | $25-$180 | 80.8% |
| Xero | $13-$70 | 9.2% |
| Freshbooks | $15-$55 | 4.5% |
Plataformas emergentes de Blockchain e Finanças Descentralizadas (DeFi)
O tamanho do mercado global de blockchain projetado para atingir US $ 69 bilhões até 2027. O Valor Total Bloqueado (TVL) atingiu US $ 53,7 bilhões em janeiro de 2024.
- Plataformas DeFi baseadas em Ethereum: 58% de participação de mercado
- Custo médio da transação no blockchain: US $ 1,50 a US $ 15
- Taxa de crescimento anual de plataformas Defi: 43,5%
Sistemas de planejamento de recursos corporativos (ERP) com recursos de pagamento integrados
| Sistema ERP | Receita anual | Integração de pagamento |
|---|---|---|
| SEIVA | US $ 33,7 bilhões | Integração de pagamento total |
| Oráculo | US $ 42,4 bilhões | Recursos de pagamento abrangentes |
| Microsoft Dynamics | US $ 16,6 bilhões | Módulos de pagamento avançados |
Contas manuais a pagar e processos a receber
Custo das contas manuais Processamento a pagar: US $ 10 a US $ 20 por fatura. Tempo médio gasto no processamento manual: 8 a 12 minutos por fatura.
- Custo de processamento de fatura baseado em papel: US $ 30 a US $ 50 por documento
- Taxa de erro manual: 1,5%-3,6%
- Custos trabalhistas anuais para processamento manual: US $ 171.000 para empresas de médio porte
Ferramentas de gerenciamento financeiro de código aberto
| Ferramenta | Base de usuários | Características |
|---|---|---|
| GNUCASH | 500.000 mais de usuários | Funções contábeis básicas |
| Erpnext | 250.000 mais de usuários | Capacidades abrangentes de ERP |
| ODOO | 7 milhões de usuários | Gestão de negócios extensa |
Bill.com Holdings, Inc. (Bill) - As cinco forças de Porter: ameaça de novos participantes
Baixos requisitos de capital inicial para desenvolvimento de software baseado em nuvem
No quarto trimestre 2023, os custos de infraestrutura em nuvem para o desenvolvimento de software diminuíram 35% em comparação com 2020, com os Serviços da Web da Amazon (AWS) oferecendo créditos de inicialização de até US $ 100.000.
| Plataforma em nuvem | Créditos de inicialização | Redução de custos de infraestrutura |
|---|---|---|
| AWS | $100,000 | 35% |
| Google Cloud | $70,000 | 32% |
| Microsoft Azure | $75,000 | 30% |
Aumento do investimento de capital de risco em fintech
A Fintech Venture Capital Investments atingiu US $ 54,4 bilhões globalmente em 2023, com 2.579 negócios concluídos.
- Média de financiamento de sementes: US $ 2,3 milhões
- Série A Média de financiamento: US $ 15,6 milhões
- Média de financiamento em estágio tardio: US $ 89,4 milhões
Barreiras tecnológicas à entrada em automação financeira avançada
O portfólio de patentes da Bill.com inclui 47 inovações tecnológicas registradas em dezembro de 2023.
| Categoria de patentes | Número de patentes |
|---|---|
| Automação de pagamento | 22 |
| Fluxo de trabalho financeiro | 15 |
| Integração de aprendizado de máquina | 10 |
Desafios de conformidade regulatória para novas empresas de tecnologia financeira
Os custos de conformidade para novas startups da FinTech têm uma média de US $ 1,2 milhão anualmente nos Estados Unidos.
- SOC 2 Custo de conformidade: $ 250.000
- Despesas anuais de arquivamento regulatório: US $ 350.000
- Conformidade de segurança cibernética: US $ 600.000
Efeitos de rede estabelecidos e base de clientes de jogadores existentes
O Bill.com reportou 430.000 clientes e uma receita de US $ 541,3 milhões no ano fiscal de 2023.
| Métrica | Valor |
|---|---|
| Total de clientes | 430,000 |
| Receita anual | US $ 541,3 milhões |
| Taxa de retenção de clientes | 92% |
Bill.com Holdings, Inc. (BILL) - Porter's Five Forces: Competitive rivalry
You're looking at the competitive intensity in the financial operations space, and honestly, it's a battleground. Bill.com Holdings, Inc. operates in a highly fragmented B2B FinTech market, targeting the massive pool of U.S. small and midsize businesses (SMBs). As of late 2025, there are approximately 34.8 million small businesses in the United States, with other estimates placing the count at 36.2 million, all of whom need efficient ways to manage payables and receivables. This sheer volume means the prize is huge, but so is the fight for adoption.
The rivalry is definitely intense, coming from multiple angles. You have direct competition from specialized platforms that focus heavily on Accounts Payable (AP) or Accounts Receivable (AR) automation. For instance, Melio, which was recently acquired by Xero for an upfront consideration of $2.5 billion in cash and equity, plus up to $0.5 billion in contingent consideration, validates the value of this automation layer. The acquisition of Melio, a direct standalone competitor, is noted to 'add to questions around Bill's capabilities'.
Then there is the established competition from players like AvidXchange, which targets mid-sized businesses with complex approval chains. Comparing the two in the Accounts Payable category, Bill.com Holdings, Inc. holds a 0.97% market share compared to AvidXchange's 0.18%, and Bill.com Holdings, Inc. has 2,823 customers versus AvidXchange's 531. This shows Bill.com Holdings, Inc. has a stronger foothold in that specific segment, but the presence of a dedicated, established player like AvidXchange keeps the pressure on for feature parity and pricing.
Competition from large, integrated accounting software providers is perhaps the most structural threat. Intuit, with QuickBooks, is clearly enhancing its capabilities organically. Intuit's AI Payments Agent helps businesses get paid an average of five days faster. Furthermore, Intuit reported that around 2.8 million customers leveraged its AI agents across Accounting, Payments, and Payroll in Q3 2025. QuickBooks 2025 also added payment flexibility, allowing clients to pay via Apple Pay, Google Pay, or ACH directly from the invoice.
Bill.com Holdings, Inc. is clearly holding its ground, though. The company's network effect is a defintely strong competitive moat. As of June 30, 2025, 8.3 million BILL standalone network members have originated or received an electronic payment using the platform, an 18% year-over-year increase. This scale is what the CEO referenced when discussing the company's 'scale advantage'.
The financial results back up the idea that Bill.com Holdings, Inc. is winning market share against this backdrop. Core revenue growth, which is subscription and transaction fees, hit 16% for the full Fiscal Year 2025, reaching $1,300.8 million. This growth rate in the core business suggests successful customer acquisition and monetization despite the competitive noise.
Here's a quick look at how the competitive pressures stack up:
| Competitive Factor | Metric/Data Point | Source/Context |
| Market Size | 34,836,451 U.S. Small Businesses (2025) | Fragmented target market |
| Network Moat | 8.3 million network members (as of June 30, 2025) | Key competitive advantage |
| BILL Growth Performance | 16% Core Revenue Growth (FY2025) | Indicates market share capture |
| Direct Rival (AvidXchange AP Share) | 0.97% Market Share for BILL vs. 0.18% for AvidXchange | Implies BILL leads in this specific comparison |
| Integrated Rival (QuickBooks AI Adoption) | 2.8 million customers leveraging AI agents (Q3 2025) | Shows scale of integrated competitor's feature adoption |
The nature of the competition forces Bill.com Holdings, Inc. to continuously differentiate its offering. You can see the focus areas in their competitive positioning:
- Focus on a more comprehensive AP/AR/Expense platform versus specialized tools like Melio.
- Offering international payment support to over 130 countries.
- Pricing structure starting at $45/mo per user for premium plans, contrasting with Melio's free base plan.
- Deeper integrations with enterprise-level software like NetSuite, beyond QuickBooks and Xero.
- Leveraging AI to enhance platform utility, mirroring the trend seen with Intuit's five-day faster payment acceleration.
Finance: draft 13-week cash view by Friday.
Bill.com Holdings, Inc. (BILL) - Porter's Five Forces: Threat of substitutes
The threat of substitutes for Bill.com Holdings, Inc. (BILL) remains a tangible concern, even as digital adoption accelerates. You have to look at what businesses are still using instead of your platform.
High threat from traditional banking B2B payment services and commercial cards.
Traditional methods, while declining, still represent a significant portion of the market you are trying to capture. For instance, B2B cheque and cash transactions in the United States fell from a high of 50% in 2019 to 32% in 2024. Still, as of 2024, a substantial 60% of B2B payments relied on paper checks, cash, and other manual approaches, indicating a large pool of potential converts. To put this in perspective against your scale, Bill.com Holdings, Inc. (BILL) processed $86 billion in total payment volume in the fourth quarter of fiscal year 2025.
Here's a quick look at the payment volume context for Bill.com Holdings, Inc. (BILL) in the latter half of fiscal year 2025:
| Metric | Q3 FY2025 Amount | Q4 FY2025 Amount |
|---|---|---|
| Total Payment Volume (TPV) | $79 billion | $86 billion |
| Total Transactions | 30 million | 33 million |
| Total Revenue | $358.2 million | $383.3 million |
Manual processes (paper checks, spreadsheets) remain a substitute, but Bill.com's AI counters this.
The persistence of manual processes is directly linked to the perceived friction of switching. As noted, 60% of B2B payments were manual as of 2024. This manual route is often chosen because it feels familiar, but it carries growing risks that Bill.com Holdings, Inc. (BILL)'s technology directly addresses. In a 2025 survey, 56% of business respondents reported an increase in fraud attempts over the prior year, with 42% noting these attacks are growing more sophisticated. Bill.com CEO René Lacerte highlighted that their AI Agents are a breakthrough, enabling touchless B2B transactions that simplify operations. That AI capability is a key differentiator against simple spreadsheet-based workflows.
Accounting software vendors embedding their own payment solutions pose a continuous threat.
This is where the threat moves from external methods to integrated competitors. Accounting software vendors are rapidly embedding payment functionality, which is a major trend. Platforms that successfully integrate accounting features are seeing 30-50% higher average contract values (ACVs) compared to those without. Furthermore, adoption rates for these embedded accounting features are already exceeding 40% across small and medium enterprise sectors. Even established players like Sage signaled this shift by expanding their Embedded Services across North America and Europe in May 2025. This means that for some SMBs, the substitute isn't a separate tool, but a feature built into the software they already use for general ledger management.
The platform's comprehensive workflow automation reduces the appeal of single-feature substitutes.
You counter single-feature substitutes by offering an end-to-end financial operations platform. The market data shows a clear preference for consolidation. Specifically, 83% of small businesses want access to financial services directly within their existing software, and 78% of those businesses would actually pay a premium for the convenience of having multiple services consolidated onto one platform. Bill.com Holdings, Inc. (BILL) served 493,800 businesses as of the end of the fourth quarter of fiscal year 2025, suggesting that the value of comprehensive workflow automation is resonating with a large customer base.
The appeal of consolidation is clear:
- Reduce time spent switching systems.
- Improve cash flow visibility.
- Gain better control over spend management.
- Simplify reconciliation processes.
Macroeconomic uncertainty could push SMBs back to cheaper, less automated methods.
When the economy tightens, cost sensitivity rises, which can make cheaper, less automated alternatives more appealing, at least temporarily. Analysts noted that in the environment leading up to the end of fiscal year 2025, customers scaled back their spend on some purchases, which resulted in lower Total Payment Volume (TPV) per customer. This behavior is a direct response to economic pressure. Furthermore, 77% of businesses expressed worry about the rising costs of accounting services, and 60% felt they might be forced to handle more work in-house due to these costs. This financial pressure is a risk because it could slow the migration away from manual processes, even as Bill.com Holdings, Inc. (BILL)'s TPV growth slowed to 13% year-over-year in Q4 FY2025, while core revenue grew by 16%.
Bill.com Holdings, Inc. (BILL) - Porter's Five Forces: Threat of new entrants
You're looking at the barriers to entry for new players trying to crack the financial operations space Bill.com Holdings, Inc. (BILL) occupies. Honestly, the threat level here leans toward low to moderate, primarily because the hurdles are structural and expensive to clear.
The regulatory environment alone acts as a massive moat. Handling payments and sensitive financial data means navigating a labyrinth of compliance requirements across state and federal levels. A new entrant doesn't just need good software; they need a fortress of legal and compliance infrastructure built around it. This isn't a simple SaaS play; it's a FinTech play where regulatory missteps can cost millions, or worse, shut you down. Bill.com's fiscal year 2025 non-GAAP gross margin of 85.0% speaks to the value captured by mastering this complexity, but also the cost of maintaining that compliance apparatus.
Building a platform that SMBs trust with their entire payables and receivables process requires significant upfront capital. You have to build trust, security, and deep integrations. Here's a snapshot of the scale Bill.com Holdings, Inc. (BILL) has already achieved, which sets a high bar for any newcomer:
| Metric | Value (As of Late 2025 Data) |
|---|---|
| Total FY 2025 Revenue | $1.46 billion |
| Businesses Served (Q4 FY 2025) | Over 493,000 |
| Standalone Network Members | 8.3 million |
| Accounting Firms on Platform | 9,000 |
That established network is perhaps the single biggest barrier. Network effects are powerful here. When a business joins Bill.com Holdings, Inc. (BILL), they gain access to a pre-existing ecosystem of vendors and accountants already on the platform. This creates a virtuous cycle that's incredibly hard to replicate from scratch. New entrants face the classic chicken-and-egg problem: no users means no value, but no value means no users.
Also, consider the existing relationships with established financial players. Bill.com Holdings, Inc. (BILL) is a trusted partner of leading U.S. financial institutions. They have bank partners like WebBank, Cross River Bank, and WEX Bank supporting their card products. While major U.S. banks could theoretically enter this space, their current strategy appears to be partnership, not direct competition, especially given Bill.com Holdings, Inc. (BILL)'s focus on expanding embedded partnerships in fiscal year 2025. Historically, Bill.com Holdings, Inc. (BILL) was the choice of 3 of the top 10 U.S. banks.
Finally, the integration depth creates high switching costs for the target customer base-SMBs. These businesses aren't just using a standalone tool; they are deeply integrated into the Bill.com Holdings, Inc. (BILL) workflow, often syncing with their ERP or accounting software. The data suggests SMBs value this consolidation:
- 83% of small businesses want financial services within their software.
- 78% would pay more for the convenience of multiple services in one platform.
- Bill.com Holdings, Inc. (BILL) boasts a 94% dollar-based net retention rate, showing existing customers stick around and spend more.
If onboarding takes 14+ days, churn risk rises, but for a new entrant, convincing an established user to rip out a system that processes $86 billion in total payment volume (Q4 FY 2025) is a monumental task. The cost isn't just the subscription fee-which starts around $45 per user/month for Essentials in 2025-it's the operational disruption.
Disclaimer
All information, articles, and product details provided on this website are for general informational and educational purposes only. We do not claim any ownership over, nor do we intend to infringe upon, any trademarks, copyrights, logos, brand names, or other intellectual property mentioned or depicted on this site. Such intellectual property remains the property of its respective owners, and any references here are made solely for identification or informational purposes, without implying any affiliation, endorsement, or partnership.
We make no representations or warranties, express or implied, regarding the accuracy, completeness, or suitability of any content or products presented. Nothing on this website should be construed as legal, tax, investment, financial, medical, or other professional advice. In addition, no part of this site—including articles or product references—constitutes a solicitation, recommendation, endorsement, advertisement, or offer to buy or sell any securities, franchises, or other financial instruments, particularly in jurisdictions where such activity would be unlawful.
All content is of a general nature and may not address the specific circumstances of any individual or entity. It is not a substitute for professional advice or services. Any actions you take based on the information provided here are strictly at your own risk. You accept full responsibility for any decisions or outcomes arising from your use of this website and agree to release us from any liability in connection with your use of, or reliance upon, the content or products found herein.