
|
Allbirds, Inc. (pássaro) DCF Avaliação |
Totalmente Editável: Adapte-Se Às Suas Necessidades No Excel Ou Planilhas
Design Profissional: Modelos Confiáveis E Padrão Da Indústria
Pré-Construídos Para Uso Rápido E Eficiente
Compatível com MAC/PC, totalmente desbloqueado
Não É Necessária Experiência; Fácil De Seguir
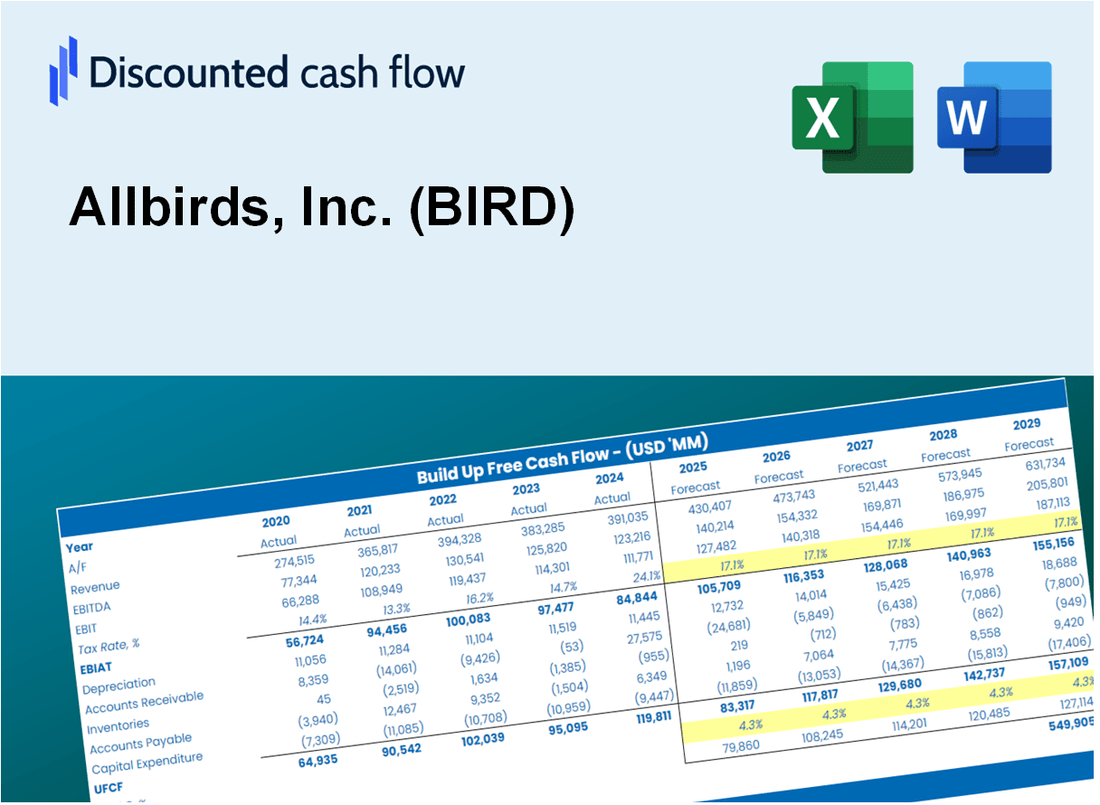
Allbirds, Inc. (BIRD) Bundle
Avalie as perspectivas financeiras da Allbirds, Inc. como um especialista! Essa calculadora (Bird) DCF fornece dados financeiros pré-preenchidos, permitindo que você complete a flexibilidade para modificar o crescimento da receita, o WACC, as margens e outras suposições essenciais para se alinhar com suas projeções.
Discounted Cash Flow (DCF) - (USD MM)
| Year | AY1 2020 |
AY2 2021 |
AY3 2022 |
AY4 2023 |
AY5 2024 |
FY1 2025 |
FY2 2026 |
FY3 2027 |
FY4 2028 |
FY5 2029 |
|---|---|---|---|---|---|---|---|---|---|---|
| Revenue | 219.3 | 277.5 | 297.8 | 254.1 | 189.8 | 186.8 | 184.0 | 181.1 | 178.4 | 175.6 |
| Revenue Growth, % | 0 | 26.53 | 7.31 | -14.68 | -25.31 | -1.54 | -1.54 | -1.54 | -1.54 | -1.54 |
| EBITDA | -22.6 | -34.4 | -81.5 | -97.8 | -81.6 | -49.2 | -48.4 | -47.7 | -46.9 | -46.2 |
| EBITDA, % | -10.3 | -12.38 | -27.38 | -38.51 | -42.98 | -26.31 | -26.31 | -26.31 | -26.31 | -26.31 |
| Depreciation | 7.1 | 10.2 | 14.7 | 21.0 | 12.4 | 10.0 | 9.8 | 9.7 | 9.5 | 9.4 |
| Depreciation, % | 3.23 | 3.68 | 4.93 | 8.27 | 6.53 | 5.33 | 5.33 | 5.33 | 5.33 | 5.33 |
| EBIT | -29.7 | -44.6 | -96.2 | -118.9 | -94.0 | -59.1 | -58.2 | -57.3 | -56.4 | -55.6 |
| EBIT, % | -13.53 | -16.06 | -32.31 | -46.78 | -49.51 | -31.64 | -31.64 | -31.64 | -31.64 | -31.64 |
| Total Cash | 126.6 | 288.6 | 167.1 | 130.0 | 66.7 | 112.2 | 110.5 | 108.8 | 107.1 | 105.4 |
| Total Cash, percent | .0 | .0 | .0 | .0 | .0 | .0 | .0 | .0 | .0 | .0 |
| Account Receivables | 23.7 | 39.9 | 17.6 | 18.3 | 13.8 | 17.0 | 16.8 | 16.5 | 16.3 | 16.0 |
| Account Receivables, % | 10.81 | 14.4 | 5.92 | 7.19 | 7.27 | 9.12 | 9.12 | 9.12 | 9.12 | 9.12 |
| Inventories | 59.2 | 106.9 | 116.8 | 57.8 | 44.1 | 56.3 | 55.5 | 54.6 | 53.8 | 52.9 |
| Inventories, % | 27.01 | 38.52 | 39.22 | 22.74 | 23.25 | 30.15 | 30.15 | 30.15 | 30.15 | 30.15 |
| Accounts Payable | 20.2 | 30.7 | 12.2 | 5.9 | 10.8 | 12.1 | 11.9 | 11.7 | 11.6 | 11.4 |
| Accounts Payable, % | 9.23 | 11.07 | 4.11 | 2.3 | 5.68 | 6.48 | 6.48 | 6.48 | 6.48 | 6.48 |
| Capital Expenditure | -14.4 | -24.2 | -31.4 | -10.9 | -4.1 | -12.0 | -11.9 | -11.7 | -11.5 | -11.3 |
| Capital Expenditure, % | -6.54 | -8.71 | -10.53 | -4.28 | -2.16 | -6.45 | -6.45 | -6.45 | -6.45 | -6.45 |
| Tax Rate, % | -2.05 | -2.05 | -2.05 | -2.05 | -2.05 | -2.05 | -2.05 | -2.05 | -2.05 | -2.05 |
| EBITAT | -25.6 | -45.4 | -97.4 | -119.1 | -95.9 | -57.5 | -56.6 | -55.7 | -54.9 | -54.0 |
| Depreciation | ||||||||||
| Changes in Account Receivables | ||||||||||
| Changes in Inventories | ||||||||||
| Changes in Accounts Payable | ||||||||||
| Capital Expenditure | ||||||||||
| UFCF | -95.5 | -112.8 | -120.2 | -57.0 | -64.5 | -73.7 | -57.7 | -56.8 | -56.0 | -55.1 |
| WACC, % | 7.32 | 7.61 | 7.61 | 7.61 | 7.61 | 7.55 | 7.55 | 7.55 | 7.55 | 7.55 |
| PV UFCF | ||||||||||
| SUM PV UFCF | -244.2 | |||||||||
| Long Term Growth Rate, % | 2.00 | |||||||||
| Free cash flow (T + 1) | -56 | |||||||||
| Terminal Value | -1,012 | |||||||||
| Present Terminal Value | -703 | |||||||||
| Enterprise Value | -948 | |||||||||
| Net Debt | -13 | |||||||||
| Equity Value | -935 | |||||||||
| Diluted Shares Outstanding, MM | 8 | |||||||||
| Equity Value Per Share | -118.86 |
What You Will Get
- Pre-Filled Financial Model: Allbirds' actual data provides an accurate DCF valuation.
- Full Forecast Control: Modify revenue growth, profit margins, WACC, and other essential drivers.
- Instant Calculations: Real-time updates ensure you see results as you adjust inputs.
- Investor-Ready Template: A polished Excel file crafted for high-quality valuation.
- Customizable and Reusable: Designed for adaptability, allowing for repeated use in detailed forecasts.
Key Features
- Real-Life BIRD Data: Pre-filled with Allbirds’ historical financials and future projections.
- Fully Customizable Inputs: Modify revenue growth, profit margins, WACC, tax rates, and capital expenditures.
- Dynamic Valuation Model: Automatic updates to Net Present Value (NPV) and intrinsic value based on your adjustments.
- Scenario Testing: Develop multiple forecast scenarios to evaluate various valuation outcomes.
- User-Friendly Design: Intuitive, organized, and tailored for both professionals and novices.
How It Works
- Step 1: Download the Excel file.
- Step 2: Review Allbirds, Inc.'s pre-filled financial data and forecasts.
- Step 3: Modify critical inputs like revenue growth, WACC, and tax rates (highlighted cells).
- Step 4: Watch the DCF model update instantly as you tweak assumptions.
- Step 5: Analyze the outputs and use the results for investment decisions regarding Allbirds, Inc. (BIRD).
Why Choose This Calculator for Allbirds, Inc. (BIRD)?
- Designed for Experts: A sophisticated tool favored by financial analysts, CFOs, and industry consultants.
- Accurate Data: Allbirds’ historical and projected financials are preloaded for precise calculations.
- Flexible Scenario Analysis: Effortlessly simulate various forecasts and assumptions.
- Comprehensive Outputs: Automatically computes intrinsic value, NPV, and essential financial metrics.
- User-Friendly: Step-by-step guidance ensures a smooth experience throughout the process.
Who Should Use Allbirds, Inc. (BIRD)?
- Eco-Conscious Consumers: Choose sustainable footwear that aligns with your values.
- Fashion Enthusiasts: Enjoy stylish designs that are both trendy and comfortable.
- Outdoor Adventurers: Experience versatile shoes that perform well in various environments.
- Health and Wellness Advocates: Benefit from shoes that prioritize comfort and foot health.
- Retailers: Explore innovative products that attract a growing market of sustainable shoppers.
What the Template Contains
- Preloaded BIRD Data: Historical and projected financial data, including revenue, EBIT, and capital expenditures.
- DCF and WACC Models: Professional-grade sheets for calculating intrinsic value and Weighted Average Cost of Capital.
- Editable Inputs: Yellow-highlighted cells for adjusting revenue growth, tax rates, and discount rates.
- Financial Statements: Comprehensive annual and quarterly financials for deeper analysis.
- Key Ratios: Profitability, leverage, and efficiency ratios to evaluate performance.
- Dashboard and Charts: Visual summaries of valuation outcomes and assumptions.
Disclaimer
All information, articles, and product details provided on this website are for general informational and educational purposes only. We do not claim any ownership over, nor do we intend to infringe upon, any trademarks, copyrights, logos, brand names, or other intellectual property mentioned or depicted on this site. Such intellectual property remains the property of its respective owners, and any references here are made solely for identification or informational purposes, without implying any affiliation, endorsement, or partnership.
We make no representations or warranties, express or implied, regarding the accuracy, completeness, or suitability of any content or products presented. Nothing on this website should be construed as legal, tax, investment, financial, medical, or other professional advice. In addition, no part of this site—including articles or product references—constitutes a solicitation, recommendation, endorsement, advertisement, or offer to buy or sell any securities, franchises, or other financial instruments, particularly in jurisdictions where such activity would be unlawful.
All content is of a general nature and may not address the specific circumstances of any individual or entity. It is not a substitute for professional advice or services. Any actions you take based on the information provided here are strictly at your own risk. You accept full responsibility for any decisions or outcomes arising from your use of this website and agree to release us from any liability in connection with your use of, or reliance upon, the content or products found herein.