
|
Birkenstock Holding Plc (Birk) DCF Avaliação |
Totalmente Editável: Adapte-Se Às Suas Necessidades No Excel Ou Planilhas
Design Profissional: Modelos Confiáveis E Padrão Da Indústria
Pré-Construídos Para Uso Rápido E Eficiente
Compatível com MAC/PC, totalmente desbloqueado
Não É Necessária Experiência; Fácil De Seguir
Birkenstock Holding plc (BIRK) Bundle
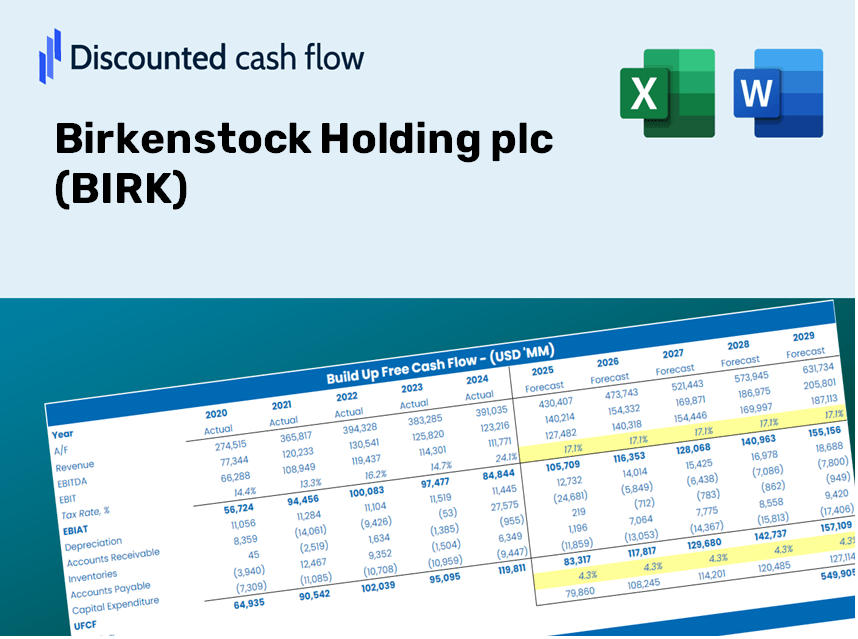
Obtenha informações sobre a análise de avaliação Birkenstock Holding Plc (BIRK) usando nossa sofisticada calculadora DCF! Este modelo do Excel, pré -carregado com dados autênticos (BIRK), permite ajustar as previsões e suposições, permitindo cálculos precisos do valor intrínseco de Birkenstock.
Discounted Cash Flow (DCF) - (USD MM)
| Year | AY1 2020 |
AY2 2021 |
AY3 2022 |
AY4 2023 |
AY5 2024 |
FY1 2025 |
FY2 2026 |
FY3 2027 |
FY4 2028 |
FY5 2029 |
|---|---|---|---|---|---|---|---|---|---|---|
| Revenue | 844.7 | 1,115.6 | 1,441.0 | 1,729.8 | 2,092.5 | 2,627.3 | 3,298.9 | 4,142.1 | 5,200.9 | 6,530.3 |
| Revenue Growth, % | 0 | 32.06 | 29.18 | 20.04 | 20.96 | 25.56 | 25.56 | 25.56 | 25.56 | 25.56 |
| EBITDA | 3.9 | 332.6 | 490.6 | 417.8 | 584.0 | 611.6 | 767.9 | 964.2 | 1,210.6 | 1,520.1 |
| EBITDA, % | 0.45927 | 29.82 | 34.05 | 24.15 | 27.91 | 23.28 | 23.28 | 23.28 | 23.28 | 23.28 |
| Depreciation | 53.4 | 65.7 | 103.9 | 96.7 | 117.4 | 160.9 | 202.1 | 253.7 | 318.6 | 400.0 |
| Depreciation, % | 6.32 | 5.89 | 7.21 | 5.59 | 5.61 | 6.13 | 6.13 | 6.13 | 6.13 | 6.13 |
| EBIT | -49.5 | 267.0 | 386.7 | 321.1 | 466.5 | 450.6 | 565.8 | 710.5 | 892.1 | 1,120.1 |
| EBIT, % | -5.86 | 23.93 | 26.83 | 18.56 | 22.3 | 17.15 | 17.15 | 17.15 | 17.15 | 17.15 |
| Total Cash | 111.5 | 272.9 | 356.0 | 410.5 | 436.5 | 562.1 | 705.7 | 886.1 | 1,112.6 | 1,397.0 |
| Total Cash, percent | .0 | .0 | .0 | .0 | .0 | .0 | .0 | .0 | .0 | .0 |
| Account Receivables | 76.3 | 63.1 | 72.5 | 103.1 | 164.9 | 176.4 | 221.5 | 278.1 | 349.1 | 438.4 |
| Account Receivables, % | 9.03 | 5.66 | 5.03 | 5.96 | 7.88 | 6.71 | 6.71 | 6.71 | 6.71 | 6.71 |
| Inventories | 245.4 | 416.5 | 621.0 | 690.0 | 724.4 | 966.8 | 1,213.9 | 1,524.2 | 1,913.8 | 2,403.0 |
| Inventories, % | 29.05 | 37.34 | 43.1 | 39.89 | 34.62 | 36.8 | 36.8 | 36.8 | 36.8 | 36.8 |
| Accounts Payable | 25.0 | 77.0 | 66.5 | 92.2 | 86.6 | 125.8 | 158.0 | 198.3 | 249.0 | 312.7 |
| Accounts Payable, % | 2.95 | 6.9 | 4.61 | 5.33 | 4.14 | 4.79 | 4.79 | 4.79 | 4.79 | 4.79 |
| Capital Expenditure | -25.9 | -25.2 | -84.2 | -119.4 | -85.7 | -116.5 | -146.2 | -183.6 | -230.6 | -289.5 |
| Capital Expenditure, % | -3.07 | -2.26 | -5.84 | -6.9 | -4.09 | -4.43 | -4.43 | -4.43 | -4.43 | -4.43 |
| Tax Rate, % | 34.78 | 34.78 | 34.78 | 34.78 | 34.78 | 34.78 | 34.78 | 34.78 | 34.78 | 34.78 |
| EBITAT | -40.5 | 206.4 | 288.8 | 156.8 | 304.3 | 313.5 | 393.6 | 494.2 | 620.5 | 779.2 |
| Depreciation | ||||||||||
| Changes in Account Receivables | ||||||||||
| Changes in Inventories | ||||||||||
| Changes in Accounts Payable | ||||||||||
| Capital Expenditure | ||||||||||
| UFCF | -309.7 | 140.9 | 84.2 | 60.3 | 234.1 | 143.4 | 189.4 | 237.8 | 298.6 | 374.9 |
| WACC, % | 8.99 | 8.93 | 8.89 | 8.53 | 8.76 | 8.82 | 8.82 | 8.82 | 8.82 | 8.82 |
| PV UFCF | ||||||||||
| SUM PV UFCF | 934.8 | |||||||||
| Long Term Growth Rate, % | 2.00 | |||||||||
| Free cash flow (T + 1) | 382 | |||||||||
| Terminal Value | 5,608 | |||||||||
| Present Terminal Value | 3,675 | |||||||||
| Enterprise Value | 4,610 | |||||||||
| Net Debt | 1,153 | |||||||||
| Equity Value | 3,457 | |||||||||
| Diluted Shares Outstanding, MM | 188 | |||||||||
| Equity Value Per Share | 18.43 |
What You Will Receive
- Authentic BIRK Financials: Access to historical and projected data for precise valuation.
- Customizable Inputs: Adjust WACC, tax rates, revenue growth, and capital expenditures at your convenience.
- Automated Calculations: Intrinsic value and NPV are calculated in real-time.
- Scenario Analysis: Explore various scenarios to assess Birkenstock's future performance.
- User-Friendly Design: Crafted for professionals while remaining accessible to newcomers.
Key Features
- 🔍 Real-Life BIRK Financials: Access pre-filled historical and projected financial data for Birkenstock Holding plc.
- ✏️ Fully Customizable Inputs: Modify essential parameters (yellow cells) such as WACC, growth %, and tax rates to fit your needs.
- 📊 Professional DCF Valuation: Utilize built-in formulas to calculate the intrinsic value of Birkenstock using the Discounted Cash Flow method.
- ⚡ Instant Results: View Birkenstock’s valuation in real-time after any adjustments are made.
- Scenario Analysis: Explore and compare the effects of different financial assumptions side-by-side.
How It Works
- Step 1: Download the Excel file.
- Step 2: Review pre-filled Birkenstock data (historical and projected).
- Step 3: Modify key assumptions (yellow cells) based on your insights.
- Step 4: Observe automatic recalculations for Birkenstock’s intrinsic value.
- Step 5: Utilize the results for investment decisions or reporting.
Why Opt for Birkenstock's Financial Calculator?
- Time Efficiency: Skip the hassle of building a DCF model from the ground up – it's preconfigured for immediate use.
- Enhanced Precision: Dependable financial data and formulas minimize valuation inaccuracies.
- Completely Adjustable: Modify the model to align with your specific assumptions and forecasts.
- User-Friendly: Intuitive charts and outputs facilitate straightforward analysis of results.
- Endorsed by Professionals: Developed for experts who prioritize accuracy and functionality.
Who Should Use This Product?
- Finance Students: Master valuation methodologies and practice applying them to actual data.
- Academics: Integrate advanced valuation models into your teaching or research initiatives.
- Investors: Validate your investment assumptions and assess valuation results for Birkenstock Holding plc (BIRK) stock.
- Analysts: Enhance your efficiency with a ready-to-use, adaptable DCF model.
- Small Business Owners: Discover how major public companies like Birkenstock Holding plc (BIRK) are evaluated.
Contents of the Template
- Pre-Filled Data: Features Birkenstock Holding plc's historical financials and projections.
- Discounted Cash Flow Model: An editable DCF valuation model with automated calculations.
- Weighted Average Cost of Capital (WACC): A dedicated worksheet for computing WACC using customized inputs.
- Key Financial Ratios: Examine Birkenstock's profitability, efficiency, and leverage metrics.
- Customizable Inputs: Easily modify revenue growth, margins, and tax rates.
- User-Friendly Dashboard: Visual representations and tables that summarize essential valuation outcomes.
Disclaimer
All information, articles, and product details provided on this website are for general informational and educational purposes only. We do not claim any ownership over, nor do we intend to infringe upon, any trademarks, copyrights, logos, brand names, or other intellectual property mentioned or depicted on this site. Such intellectual property remains the property of its respective owners, and any references here are made solely for identification or informational purposes, without implying any affiliation, endorsement, or partnership.
We make no representations or warranties, express or implied, regarding the accuracy, completeness, or suitability of any content or products presented. Nothing on this website should be construed as legal, tax, investment, financial, medical, or other professional advice. In addition, no part of this site—including articles or product references—constitutes a solicitation, recommendation, endorsement, advertisement, or offer to buy or sell any securities, franchises, or other financial instruments, particularly in jurisdictions where such activity would be unlawful.
All content is of a general nature and may not address the specific circumstances of any individual or entity. It is not a substitute for professional advice or services. Any actions you take based on the information provided here are strictly at your own risk. You accept full responsibility for any decisions or outcomes arising from your use of this website and agree to release us from any liability in connection with your use of, or reliance upon, the content or products found herein.