
|
Bakkt Holdings, Inc. (BKKT) Avaliação DCF |
Totalmente Editável: Adapte-Se Às Suas Necessidades No Excel Ou Planilhas
Design Profissional: Modelos Confiáveis E Padrão Da Indústria
Pré-Construídos Para Uso Rápido E Eficiente
Compatível com MAC/PC, totalmente desbloqueado
Não É Necessária Experiência; Fácil De Seguir
Bakkt Holdings, Inc. (BKKT) Bundle
Procurando calcular o valor intrínseco da Bakkt Holdings, Inc.? Nossa calculadora BKKT DCF integra dados do mundo real com recursos abrangentes de personalização, permitindo ajustar as previsões e aprimorar suas decisões de investimento.
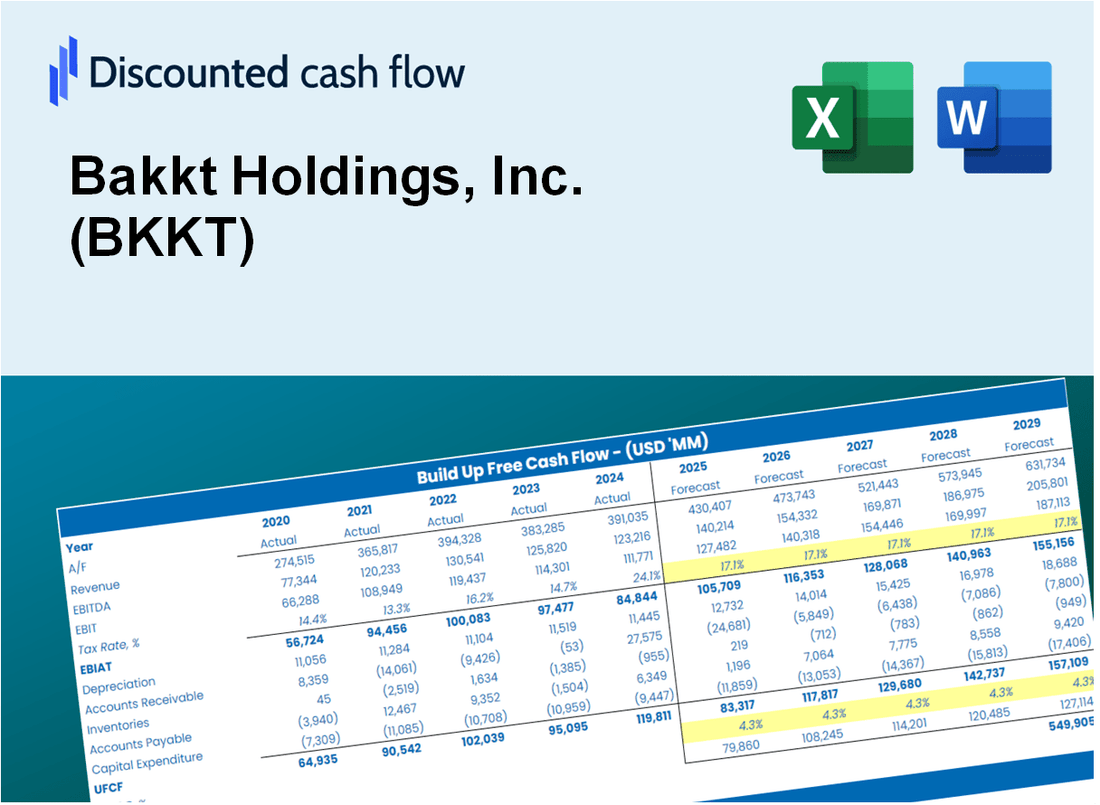
Discounted Cash Flow (DCF) - (USD MM)
| Year | AY1 2020 |
AY2 2021 |
AY3 2022 |
AY4 2023 |
AY5 2024 |
FY1 2025 |
FY2 2026 |
FY3 2027 |
FY4 2028 |
FY5 2029 |
|---|---|---|---|---|---|---|---|---|---|---|
| Revenue | 28.5 | 37.3 | 56.2 | 780.1 | 3,490.2 | 5,947.9 | 10,136.0 | 17,273.3 | 29,436.3 | 50,163.8 |
| Revenue Growth, % | 0 | 30.74 | 50.92 | 1287.55 | 347.39 | 70.41 | 70.41 | 70.41 | 70.41 | 70.41 |
| EBITDA | -43.4 | -134.7 | -152.0 | -114.3 | -83.4 | -3,771.4 | -6,427.0 | -10,952.6 | -18,664.8 | -31,807.6 |
| EBITDA, % | -152.24 | -361.7 | -270.29 | -14.65 | -2.39 | -63.41 | -63.41 | -63.41 | -63.41 | -63.41 |
| Depreciation | 7.1 | 14.5 | 25.4 | 13.9 | .3 | 1,316.6 | 2,243.7 | 3,823.6 | 6,516.1 | 11,104.3 |
| Depreciation, % | 24.82 | 38.98 | 45.09 | 1.79 | 0.00982746 | 22.14 | 22.14 | 22.14 | 22.14 | 22.14 |
| EBIT | -50.5 | -149.3 | -177.3 | -128.2 | -83.7 | -3,792.8 | -6,463.4 | -11,014.6 | -18,770.5 | -31,987.8 |
| EBIT, % | -177.07 | -400.68 | -315.38 | -16.44 | -2.4 | -63.77 | -63.77 | -63.77 | -63.77 | -63.77 |
| Total Cash | 77.2 | 407.9 | 239.4 | 70.3 | 39.0 | 3,689.2 | 6,286.9 | 10,713.8 | 18,258.0 | 31,114.3 |
| Total Cash, percent | .0 | .0 | .0 | .0 | .0 | .0 | .0 | .0 | .0 | .0 |
| Account Receivables | 8.1 | 18.1 | 25.3 | 29.7 | 24.6 | 1,506.3 | 2,567.0 | 4,374.6 | 7,454.9 | 12,704.3 |
| Account Receivables, % | 28.41 | 48.7 | 45.01 | 3.8 | 0.7062 | 25.33 | 25.33 | 25.33 | 25.33 | 25.33 |
| Inventories | .0 | .0 | .0 | .0 | .0 | .0 | .0 | .0 | .0 | .0 |
| Inventories, % | 0 | 0 | 0 | 0 | 0 | 0 | 0 | 0 | 0 | 0 |
| Accounts Payable | 7.2 | 10.6 | 26.0 | 14.9 | 12.8 | 1,215.7 | 2,071.8 | 3,530.7 | 6,016.8 | 10,253.5 |
| Accounts Payable, % | 25.14 | 28.58 | 46.2 | 1.91 | 0.36622 | 20.44 | 20.44 | 20.44 | 20.44 | 20.44 |
| Capital Expenditure | -20.6 | -15.7 | -30.5 | -9.4 | -3.1 | -2,021.2 | -3,444.5 | -5,870.0 | -10,003.3 | -17,047.1 |
| Capital Expenditure, % | -72.18 | -42.11 | -54.32 | -1.21 | -0.08844715 | -33.98 | -33.98 | -33.98 | -33.98 | -33.98 |
| Tax Rate, % | 54.82 | 54.82 | 54.82 | 54.82 | 54.82 | 54.82 | 54.82 | 54.82 | 54.82 | 54.82 |
| EBITAT | -50.7 | -82.2 | -51.2 | -42.6 | -37.8 | -1,990.2 | -3,391.6 | -5,779.7 | -9,849.5 | -16,785.1 |
| Depreciation | ||||||||||
| Changes in Account Receivables | ||||||||||
| Changes in Inventories | ||||||||||
| Changes in Accounts Payable | ||||||||||
| Capital Expenditure | ||||||||||
| UFCF | -65.1 | -90.0 | -48.3 | -53.5 | -37.7 | -2,973.5 | -4,797.0 | -8,174.8 | -13,931.0 | -23,740.5 |
| WACC, % | 25.71 | 25.4 | 25.22 | 25.25 | 25.34 | 25.38 | 25.38 | 25.38 | 25.38 | 25.38 |
| PV UFCF | ||||||||||
| SUM PV UFCF | -22,866.8 | |||||||||
| Long Term Growth Rate, % | 2.00 | |||||||||
| Free cash flow (T + 1) | -24,215 | |||||||||
| Terminal Value | -103,551 | |||||||||
| Present Terminal Value | -33,414 | |||||||||
| Enterprise Value | -56,281 | |||||||||
| Net Debt | -16 | |||||||||
| Equity Value | -56,265 | |||||||||
| Diluted Shares Outstanding, MM | 6 | |||||||||
| Equity Value Per Share | -9,609.67 |
What You Will Get
- Real Bakkt Data: Preloaded financials – from revenue to EBIT – based on actual and projected figures.
- Full Customization: Adjust all critical parameters (yellow cells) like WACC, growth %, and tax rates.
- Instant Valuation Updates: Automatic recalculations to analyze the impact of changes on Bakkt Holdings’ fair value.
- Versatile Excel Template: Tailored for quick edits, scenario testing, and detailed projections.
- Time-Saving and Accurate: Skip building models from scratch while maintaining precision and flexibility.
Key Features
- Comprehensive Financial Data: Bakkt Holdings, Inc.’s historical financial statements and pre-filled forecasts.
- Customizable Parameters: Modify WACC, tax rates, revenue growth, and EBITDA margins to suit your analysis.
- Real-Time Valuation: Instantly see Bakkt’s intrinsic value update as you adjust inputs.
- Intuitive Visualizations: Dashboard graphs showcase valuation results and essential metrics.
- Designed for Precision: A professional-grade tool tailored for analysts, investors, and finance professionals.
How It Works
- Download the Template: Gain immediate access to the Excel-based BKKT DCF Calculator.
- Input Your Assumptions: Modify the yellow-highlighted cells for growth rates, WACC, margins, and more.
- Instant Calculations: The model automatically refreshes Bakkt Holdings’ intrinsic value.
- Test Scenarios: Experiment with different assumptions to assess potential valuation shifts.
- Analyze and Decide: Utilize the results to inform your investment or financial strategy.
Why Choose This Calculator?
- Designed for Experts: A sophisticated tool tailored for analysts, CFOs, and financial consultants.
- Accurate Data: Bakkt’s historical and projected financials preloaded for precision.
- Scenario Analysis: Effortlessly simulate various forecasts and assumptions.
- Comprehensive Outputs: Automatically computes intrinsic value, NPV, and essential metrics.
- User-Friendly: Step-by-step guidance ensures a smooth experience.
Who Should Use Bakkt Holdings, Inc. (BKKT)?
- Investors: Make informed decisions with a cutting-edge platform designed for digital asset management.
- Financial Analysts: Enhance your analysis with integrated tools for cryptocurrency valuation and forecasting.
- Consultants: Easily customize reports and presentations tailored to client needs in the digital asset space.
- Finance Enthusiasts: Expand your knowledge of blockchain and digital assets through hands-on experience.
- Educators and Students: Utilize it as a comprehensive resource for courses focused on finance and emerging technologies.
What the Template Contains
- Comprehensive DCF Model: Editable template with detailed valuation calculations for Bakkt Holdings, Inc. (BKKT).
- Real-World Data: Bakkt’s historical and projected financials preloaded for analysis.
- Customizable Parameters: Adjust WACC, growth rates, and tax assumptions to test various scenarios.
- Financial Statements: Full annual and quarterly breakdowns for deeper insights into Bakkt's performance.
- Key Ratios: Built-in analysis for profitability, efficiency, and leverage specific to Bakkt Holdings, Inc. (BKKT).
- Dashboard with Visual Outputs: Charts and tables for clear, actionable results tailored to Bakkt's financial data.
Disclaimer
All information, articles, and product details provided on this website are for general informational and educational purposes only. We do not claim any ownership over, nor do we intend to infringe upon, any trademarks, copyrights, logos, brand names, or other intellectual property mentioned or depicted on this site. Such intellectual property remains the property of its respective owners, and any references here are made solely for identification or informational purposes, without implying any affiliation, endorsement, or partnership.
We make no representations or warranties, express or implied, regarding the accuracy, completeness, or suitability of any content or products presented. Nothing on this website should be construed as legal, tax, investment, financial, medical, or other professional advice. In addition, no part of this site—including articles or product references—constitutes a solicitation, recommendation, endorsement, advertisement, or offer to buy or sell any securities, franchises, or other financial instruments, particularly in jurisdictions where such activity would be unlawful.
All content is of a general nature and may not address the specific circumstances of any individual or entity. It is not a substitute for professional advice or services. Any actions you take based on the information provided here are strictly at your own risk. You accept full responsibility for any decisions or outcomes arising from your use of this website and agree to release us from any liability in connection with your use of, or reliance upon, the content or products found herein.