
|
Avaliação DCF da Ballard Power Systems Inc. (BLDP) |
Totalmente Editável: Adapte-Se Às Suas Necessidades No Excel Ou Planilhas
Design Profissional: Modelos Confiáveis E Padrão Da Indústria
Pré-Construídos Para Uso Rápido E Eficiente
Compatível com MAC/PC, totalmente desbloqueado
Não É Necessária Experiência; Fácil De Seguir
Ballard Power Systems Inc. (BLDP) Bundle
Explore as perspectivas financeiras da Ballard Power Systems Inc. (BLDP) com nossa calculadora DCF amigável! Digite suas projeções de crescimento, margens e despesas para determinar o valor intrínseco da Ballard Power Systems Inc. (BLDP) e moldar sua estratégia de investimento.
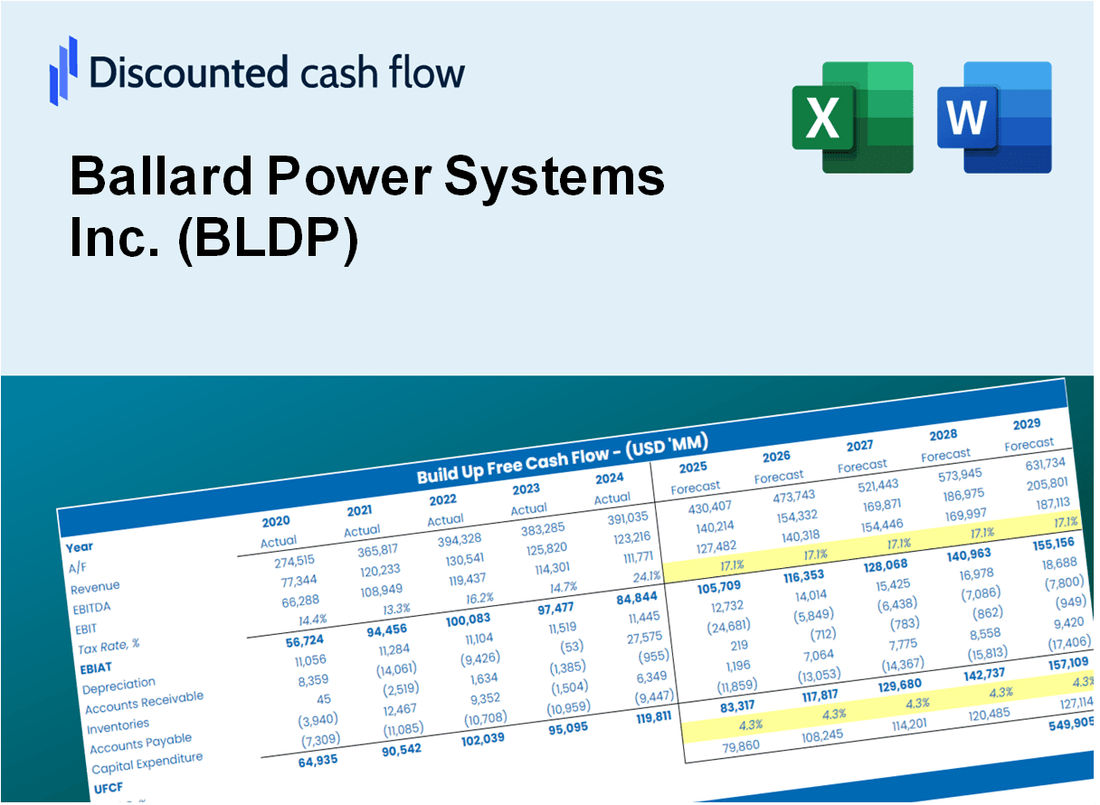
Discounted Cash Flow (DCF) - (USD MM)
| Year | AY1 2020 |
AY2 2021 |
AY3 2022 |
AY4 2023 |
AY5 2024 |
FY1 2025 |
FY2 2026 |
FY3 2027 |
FY4 2028 |
FY5 2029 |
|---|---|---|---|---|---|---|---|---|---|---|
| Revenue | 103.9 | 104.5 | 83.8 | 102.4 | 69.7 | 64.7 | 60.0 | 55.7 | 51.6 | 47.9 |
| Revenue Growth, % | 0 | 0.60456 | -19.81 | 22.16 | -31.88 | -7.23 | -7.23 | -7.23 | -7.23 | -7.23 |
| EBITDA | -40.2 | -86.7 | -145.1 | -122.3 | -309.3 | -54.5 | -50.6 | -46.9 | -43.5 | -40.4 |
| EBITDA, % | -38.7 | -82.92 | -173.15 | -119.44 | -443.55 | -84.33 | -84.33 | -84.33 | -84.33 | -84.33 |
| Depreciation | 7.8 | 9.7 | 11.2 | 13.5 | 12.0 | 7.8 | 7.3 | 6.7 | 6.2 | 5.8 |
| Depreciation, % | 7.51 | 9.25 | 13.35 | 13.21 | 17.17 | 12.1 | 12.1 | 12.1 | 12.1 | 12.1 |
| EBIT | -48.0 | -96.3 | -156.3 | -135.8 | -321.3 | -56.7 | -52.6 | -48.8 | -45.3 | -42.0 |
| EBIT, % | -46.21 | -92.17 | -186.51 | -132.65 | -460.72 | -87.68 | -87.68 | -87.68 | -87.68 | -87.68 |
| Total Cash | 765.4 | 1,126.9 | 915.7 | 753.2 | 606.1 | 64.7 | 60.0 | 55.7 | 51.6 | 47.9 |
| Total Cash, percent | .0 | .0 | .0 | .0 | .0 | .0 | .0 | .0 | .0 | .0 |
| Account Receivables | 56.8 | 39.8 | 38.6 | 58.6 | 32.0 | 31.3 | 29.0 | 26.9 | 25.0 | 23.2 |
| Account Receivables, % | 54.68 | 38.09 | 46.05 | 57.21 | 45.87 | 48.38 | 48.38 | 48.38 | 48.38 | 48.38 |
| Inventories | 28.5 | 51.5 | 58.1 | 45.9 | 56.4 | 35.2 | 32.6 | 30.3 | 28.1 | 26.0 |
| Inventories, % | 27.46 | 49.3 | 69.27 | 44.81 | 80.91 | 54.35 | 54.35 | 54.35 | 54.35 | 54.35 |
| Accounts Payable | 9.1 | 13.7 | 20.4 | 13.7 | 12.3 | 10.0 | 9.3 | 8.6 | 8.0 | 7.4 |
| Accounts Payable, % | 8.73 | 13.1 | 24.39 | 13.41 | 17.64 | 15.45 | 15.45 | 15.45 | 15.45 | 15.45 |
| Capital Expenditure | -12.9 | -14.7 | -34.5 | -41.4 | -27.6 | -19.1 | -17.7 | -16.4 | -15.2 | -14.1 |
| Capital Expenditure, % | -12.39 | -14.07 | -41.15 | -40.41 | -39.61 | -29.52 | -29.52 | -29.52 | -29.52 | -29.52 |
| Tax Rate, % | -0.2585 | -0.2585 | -0.2585 | -0.2585 | -0.2585 | -0.2585 | -0.2585 | -0.2585 | -0.2585 | -0.2585 |
| EBITAT | -48.1 | -96.1 | -153.2 | -167.5 | -322.1 | -56.5 | -52.4 | -48.6 | -45.1 | -41.8 |
| Depreciation | ||||||||||
| Changes in Account Receivables | ||||||||||
| Changes in Inventories | ||||||||||
| Changes in Accounts Payable | ||||||||||
| Capital Expenditure | ||||||||||
| UFCF | -129.4 | -102.6 | -175.0 | -209.9 | -323.1 | -48.1 | -58.8 | -54.5 | -50.6 | -46.9 |
| WACC, % | 11.76 | 11.76 | 11.75 | 11.76 | 11.76 | 11.76 | 11.76 | 11.76 | 11.76 | 11.76 |
| PV UFCF | ||||||||||
| SUM PV UFCF | -188.5 | |||||||||
| Long Term Growth Rate, % | 2.00 | |||||||||
| Free cash flow (T + 1) | -48 | |||||||||
| Terminal Value | -490 | |||||||||
| Present Terminal Value | -281 | |||||||||
| Enterprise Value | -470 | |||||||||
| Net Debt | -580 | |||||||||
| Equity Value | 110 | |||||||||
| Diluted Shares Outstanding, MM | 299 | |||||||||
| Equity Value Per Share | 0.37 |
What You Will Get
- Real Ballard Data: Preloaded financials – from revenue to EBIT – based on actual and projected figures for Ballard Power Systems Inc. (BLDP).
- Full Customization: Adjust all critical parameters (yellow cells) like WACC, growth %, and tax rates specific to Ballard Power Systems Inc. (BLDP).
- Instant Valuation Updates: Automatic recalculations to analyze the impact of changes on Ballard Power Systems Inc. (BLDP)’s fair value.
- Versatile Excel Template: Tailored for quick edits, scenario testing, and detailed projections relevant to Ballard Power Systems Inc. (BLDP).
- Time-Saving and Accurate: Skip building models from scratch while maintaining precision and flexibility for Ballard Power Systems Inc. (BLDP).
Key Features
- Customizable Input Parameters: Adjust vital metrics such as hydrogen production capacity, operational efficiency, and R&D expenditures.
- Instant DCF Valuation: Automatically computes intrinsic value, NPV, and other financial metrics without delay.
- High Precision Analysis: Incorporates Ballard's actual financial data for accurate valuation results.
- Effortless Scenario Testing: Easily evaluate various assumptions and analyze their impacts on outcomes.
- Efficiency Booster: Streamline your process by avoiding the construction of intricate valuation models from the ground up.
How It Works
- Step 1: Download the Excel file.
- Step 2: Review pre-entered Ballard Power Systems Inc. (BLDP) data (historical and projected).
- Step 3: Adjust key assumptions (yellow cells) based on your analysis.
- Step 4: View automatic recalculations for Ballard Power Systems Inc. (BLDP)’s intrinsic value.
- Step 5: Use the outputs for investment decisions or reporting.
Why Choose Ballard Power Systems Inc. (BLDP) Calculator?
- Save Time: Skip the hassle of building a model from scratch – it's ready for immediate use.
- Enhance Accuracy: Dependable financial data and formulas minimize valuation errors.
- Completely Customizable: Adjust the model to align with your assumptions and forecasts.
- User-Friendly: Intuitive charts and outputs simplify the analysis of results.
- Endorsed by Professionals: Crafted for experts who prioritize precision and functionality.
Who Should Use This Product?
- Energy Students: Explore fuel cell technologies and apply theoretical concepts using real-world data.
- Researchers: Integrate advanced models related to renewable energy into academic studies or projects.
- Investors: Evaluate your investment strategies and assess valuation metrics for Ballard Power Systems Inc. (BLDP).
- Market Analysts: Enhance your analysis with a ready-to-use, customizable financial model tailored for the energy sector.
- Entrepreneurs: Understand how established companies like Ballard Power Systems Inc. (BLDP) are evaluated in the market.
What the Template Contains
- Pre-Filled DCF Model: Ballard Power Systems Inc.'s (BLDP) financial data preloaded for immediate use.
- WACC Calculator: Detailed calculations for Weighted Average Cost of Capital.
- Financial Ratios: Evaluate Ballard Power Systems Inc.'s (BLDP) profitability, leverage, and efficiency.
- Editable Inputs: Change assumptions such as growth, margins, and CAPEX to fit your scenarios.
- Financial Statements: Annual and quarterly reports to support detailed analysis.
- Interactive Dashboard: Easily visualize key valuation metrics and results.
Disclaimer
All information, articles, and product details provided on this website are for general informational and educational purposes only. We do not claim any ownership over, nor do we intend to infringe upon, any trademarks, copyrights, logos, brand names, or other intellectual property mentioned or depicted on this site. Such intellectual property remains the property of its respective owners, and any references here are made solely for identification or informational purposes, without implying any affiliation, endorsement, or partnership.
We make no representations or warranties, express or implied, regarding the accuracy, completeness, or suitability of any content or products presented. Nothing on this website should be construed as legal, tax, investment, financial, medical, or other professional advice. In addition, no part of this site—including articles or product references—constitutes a solicitation, recommendation, endorsement, advertisement, or offer to buy or sell any securities, franchises, or other financial instruments, particularly in jurisdictions where such activity would be unlawful.
All content is of a general nature and may not address the specific circumstances of any individual or entity. It is not a substitute for professional advice or services. Any actions you take based on the information provided here are strictly at your own risk. You accept full responsibility for any decisions or outcomes arising from your use of this website and agree to release us from any liability in connection with your use of, or reliance upon, the content or products found herein.