
|
Blue Foundry Bancorp (Blfy) Avaliação DCF |
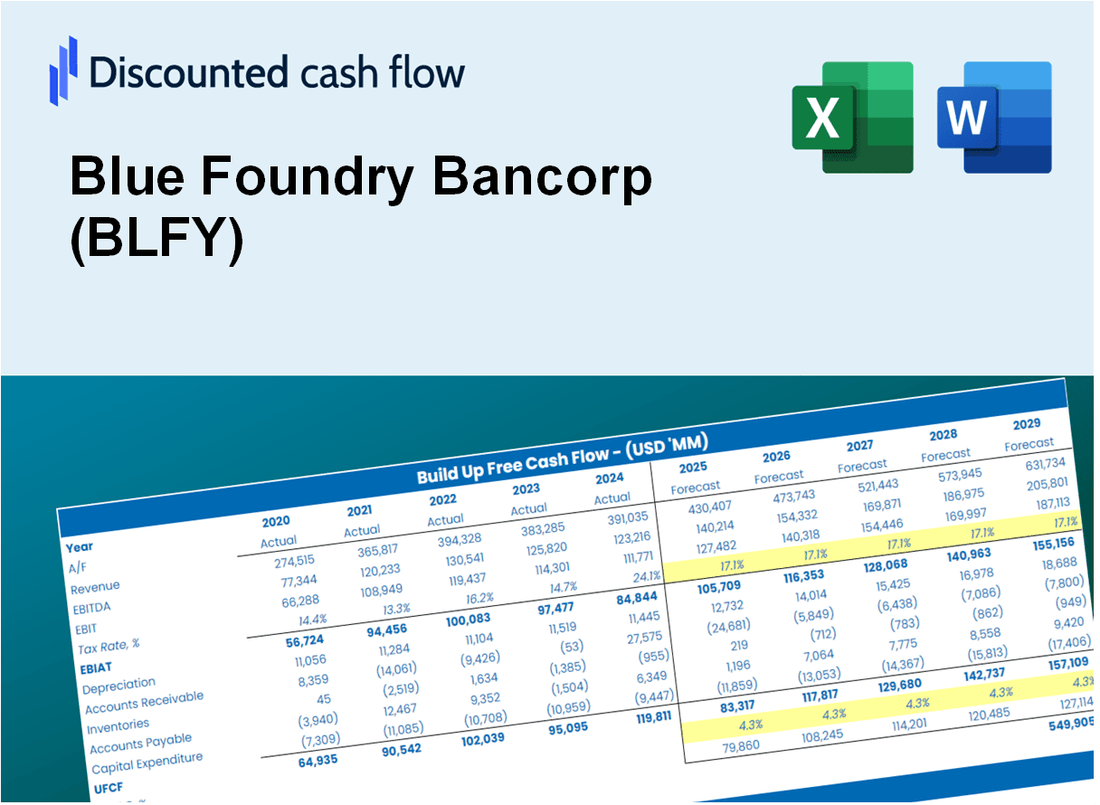
Totalmente Editável: Adapte-Se Às Suas Necessidades No Excel Ou Planilhas
Design Profissional: Modelos Confiáveis E Padrão Da Indústria
Pré-Construídos Para Uso Rápido E Eficiente
Compatível com MAC/PC, totalmente desbloqueado
Não É Necessária Experiência; Fácil De Seguir
Blue Foundry Bancorp (BLFY) Bundle
Otimize seu tempo e melhore a precisão com a nossa calculadora DCF (BLFY)! Utilizando dados em tempo real do Blue Foundry Bancorp e suposições personalizáveis, essa ferramenta permite que você preveja, analise e avalie (BLFY) como um investidor experiente.
What You Will Get
- Real BLFY Financial Data: Pre-filled with Blue Foundry Bancorp’s historical and projected data for precise analysis.
- Fully Editable Template: Modify key inputs like revenue growth, WACC, and EBITDA % with ease.
- Automatic Calculations: See Blue Foundry Bancorp’s intrinsic value update instantly based on your changes.
- Professional Valuation Tool: Designed for investors, analysts, and consultants seeking accurate DCF results.
- User-Friendly Design: Simple structure and clear instructions for all experience levels.
Key Features
- Pre-Loaded Data: Blue Foundry Bancorp’s historical financial statements and pre-filled forecasts.
- Fully Adjustable Inputs: Edit WACC, tax rates, revenue growth, and EBITDA margins tailored to (BLFY).
- Instant Results: Watch (BLFY)’s intrinsic value recalculate in real time.
- Clear Visual Outputs: Dashboard charts showcase valuation results and key metrics for (BLFY).
- Built for Accuracy: A professional tool designed for analysts, investors, and finance experts focused on (BLFY).
How It Works
- Download the Template: Get instant access to the Excel-based BLFY DCF Calculator.
- Input Your Assumptions: Modify the yellow-highlighted cells for growth rates, WACC, margins, and more.
- Instant Calculations: The model automatically recalculates Blue Foundry Bancorp’s intrinsic value.
- Test Scenarios: Experiment with different assumptions to assess potential valuation shifts.
- Analyze and Decide: Leverage the results to inform your investment or financial analysis.
Why Choose Blue Foundry Bancorp (BLFY)?
- Innovative Solutions: Benefit from cutting-edge banking services tailored to your needs.
- Customer-Centric Approach: Experience personalized support that prioritizes your financial goals.
- Robust Security: Enjoy peace of mind with advanced security measures to protect your assets.
- Transparent Pricing: Understand your fees clearly with no hidden costs or surprises.
- Proven Track Record: Join a community of satisfied clients who trust our expertise in banking.
Who Should Use This Product?
- Investors: Evaluate Blue Foundry Bancorp’s (BLFY) financial health before making investment decisions.
- CFOs and Financial Analysts: Optimize valuation methodologies and validate financial forecasts.
- Startup Founders: Understand the valuation strategies employed by established financial institutions like Blue Foundry Bancorp.
- Consultants: Provide expert valuation insights and reports for clients in the banking sector.
- Students and Educators: Utilize real-time data to teach and learn about banking valuations and financial analysis.
What the Template Contains
- Preloaded BLFY Data: Historical and projected financial data, including revenue, net income, and loan growth.
- DCF and WACC Models: Professional-grade sheets for calculating intrinsic value and Weighted Average Cost of Capital.
- Editable Inputs: Yellow-highlighted cells for adjusting loan growth rates, tax rates, and discount rates.
- Financial Statements: Comprehensive annual and quarterly financials for deeper analysis.
- Key Ratios: Profitability, leverage, and efficiency ratios to evaluate performance.
- Dashboard and Charts: Visual summaries of valuation outcomes and assumptions.
Disclaimer
All information, articles, and product details provided on this website are for general informational and educational purposes only. We do not claim any ownership over, nor do we intend to infringe upon, any trademarks, copyrights, logos, brand names, or other intellectual property mentioned or depicted on this site. Such intellectual property remains the property of its respective owners, and any references here are made solely for identification or informational purposes, without implying any affiliation, endorsement, or partnership.
We make no representations or warranties, express or implied, regarding the accuracy, completeness, or suitability of any content or products presented. Nothing on this website should be construed as legal, tax, investment, financial, medical, or other professional advice. In addition, no part of this site—including articles or product references—constitutes a solicitation, recommendation, endorsement, advertisement, or offer to buy or sell any securities, franchises, or other financial instruments, particularly in jurisdictions where such activity would be unlawful.
All content is of a general nature and may not address the specific circumstances of any individual or entity. It is not a substitute for professional advice or services. Any actions you take based on the information provided here are strictly at your own risk. You accept full responsibility for any decisions or outcomes arising from your use of this website and agree to release us from any liability in connection with your use of, or reliance upon, the content or products found herein.