
|
Bluebird Bio, Inc. (azul) Avaliação DCF |
Totalmente Editável: Adapte-Se Às Suas Necessidades No Excel Ou Planilhas
Design Profissional: Modelos Confiáveis E Padrão Da Indústria
Pré-Construídos Para Uso Rápido E Eficiente
Compatível com MAC/PC, totalmente desbloqueado
Não É Necessária Experiência; Fácil De Seguir
bluebird bio, Inc. (BLUE) Bundle
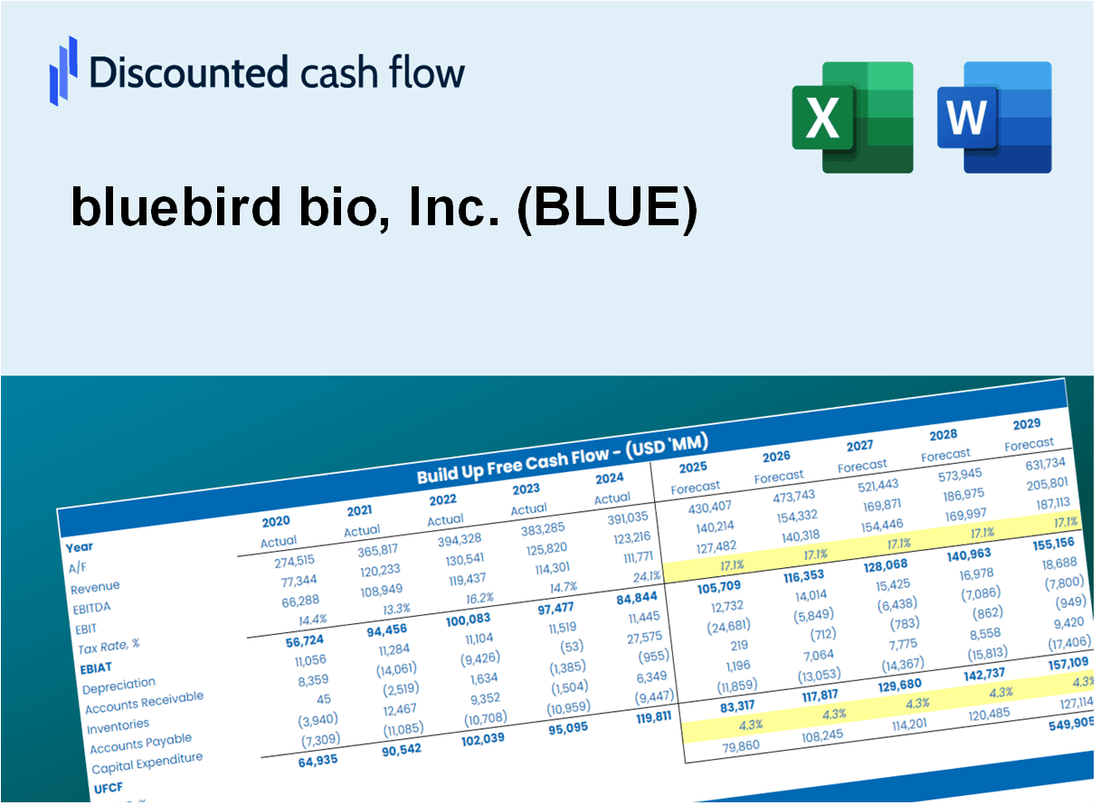
Simplifique a avaliação Bluebird Bio, Inc. (azul) com esta calculadora DCF personalizável! Apresentando o Real Bluebird Bio, Inc. (azul) financeiras e insumos de previsão ajustáveis, você pode testar cenários e descobrir o valor justo Bluebird Bio, Inc. (azul) em minutos.
Discounted Cash Flow (DCF) - (USD MM)
| Year | AY1 2020 |
AY2 2021 |
AY3 2022 |
AY4 2023 |
AY5 2024 |
FY1 2025 |
FY2 2026 |
FY3 2027 |
FY4 2028 |
FY5 2029 |
|---|---|---|---|---|---|---|---|---|---|---|
| Revenue | 250.7 | 3.7 | 3.6 | 29.5 | 83.8 | 104.7 | 130.8 | 163.4 | 204.1 | 255.0 |
| Revenue Growth, % | 0 | -98.54 | -1.77 | 720.04 | 184.12 | 24.92 | 24.92 | 24.92 | 24.92 | 24.92 |
| EBITDA | -553.6 | -556.9 | -215.6 | -167.2 | -156.8 | -104.7 | -130.8 | -163.4 | -204.1 | -255.0 |
| EBITDA, % | -220.8 | -15208.25 | -5992.74 | -566.71 | -187.12 | -100 | -100 | -100 | -100 | -100 |
| Depreciation | 5.6 | 5.5 | 5.0 | 28.5 | 61.2 | 77.9 | 97.3 | 121.6 | 151.9 | 189.7 |
| Depreciation, % | 2.24 | 148.94 | 139.03 | 96.7 | 73.08 | 74.41 | 74.41 | 74.41 | 74.41 | 74.41 |
| EBIT | -559.3 | -562.4 | -220.6 | -195.7 | -218.1 | -104.7 | -130.8 | -163.4 | -204.1 | -255.0 |
| EBIT, % | -223.05 | -15357.18 | -6131.78 | -663.41 | -260.2 | -100 | -100 | -100 | -100 | -100 |
| Total Cash | 1,274.1 | 396.6 | 181.7 | 221.8 | 62.3 | 99.3 | 124.1 | 155.0 | 193.6 | 241.9 |
| Total Cash, percent | .0 | .0 | .0 | .0 | .0 | .0 | .0 | .0 | .0 | .0 |
| Account Receivables | 2.4 | 11.4 | 10.8 | 13.0 | 3.1 | 52.1 | 65.1 | 81.3 | 101.5 | 126.8 |
| Account Receivables, % | 0.94602 | 311 | 299.89 | 44.1 | 3.69 | 49.75 | 49.75 | 49.75 | 49.75 | 49.75 |
| Inventories | -149.7 | -108.5 | -1.4 | 22.9 | 65.0 | -9.2 | -11.4 | -14.3 | -17.9 | -22.3 |
| Inventories, % | -59.71 | -2962.94 | -39.31 | 77.7 | 77.58 | -8.75 | -8.75 | -8.75 | -8.75 | -8.75 |
| Accounts Payable | 13.8 | 25.9 | 14.9 | 18.5 | 34.3 | 64.7 | 80.9 | 101.0 | 126.2 | 157.6 |
| Accounts Payable, % | 5.51 | 706.8 | 413.32 | 62.71 | 40.95 | 61.83 | 61.83 | 61.83 | 61.83 | 61.83 |
| Capital Expenditure | -29.0 | -23.0 | -13.2 | -9.1 | -2.6 | -51.4 | -64.2 | -80.2 | -100.2 | -125.1 |
| Capital Expenditure, % | -11.56 | -628.15 | -367.19 | -30.7 | -3.1 | -49.07 | -49.07 | -49.07 | -49.07 | -49.07 |
| Tax Rate, % | -0.02908849 | -0.02908849 | -0.02908849 | -0.02908849 | -0.02908849 | -0.02908849 | -0.02908849 | -0.02908849 | -0.02908849 | -0.02908849 |
| EBITAT | -559.9 | -562.6 | -220.7 | -195.6 | -218.1 | -104.7 | -130.8 | -163.4 | -204.1 | -254.9 |
| Depreciation | ||||||||||
| Changes in Account Receivables | ||||||||||
| Changes in Inventories | ||||||||||
| Changes in Accounts Payable | ||||||||||
| Capital Expenditure | ||||||||||
| UFCF | -422.1 | -618.3 | -346.4 | -199.0 | -175.8 | -22.6 | -92.2 | -115.2 | -143.9 | -179.7 |
| WACC, % | 6.24 | 6.24 | 6.24 | 6.23 | 6.24 | 6.24 | 6.24 | 6.24 | 6.24 | 6.24 |
| PV UFCF | ||||||||||
| SUM PV UFCF | -444.8 | |||||||||
| Long Term Growth Rate, % | 2.00 | |||||||||
| Free cash flow (T + 1) | -183 | |||||||||
| Terminal Value | -4,328 | |||||||||
| Present Terminal Value | -3,199 | |||||||||
| Enterprise Value | -3,643 | |||||||||
| Net Debt | 296 | |||||||||
| Equity Value | -3,939 | |||||||||
| Diluted Shares Outstanding, MM | 10 | |||||||||
| Equity Value Per Share | -406.58 |
What You Will Get
- Real bluebird bio Data: Preloaded financials – from revenue to EBIT – based on actual and projected figures.
- Full Customization: Adjust all critical parameters (yellow cells) like WACC, growth %, and tax rates.
- Instant Valuation Updates: Automatic recalculations to analyze the impact of changes on bluebird bio’s fair value.
- Versatile Excel Template: Tailored for quick edits, scenario testing, and detailed projections.
- Time-Saving and Accurate: Skip building models from scratch while maintaining precision and flexibility.
Key Features
- Customizable Clinical Parameters: Adjust essential inputs such as treatment efficacy, patient demographics, and cost projections.
- Instant DCF Valuation: Computes intrinsic value, net present value, and other financial metrics on-the-fly.
- High-Precision Accuracy: Leverages bluebird bio’s actual financial data for credible valuation results.
- Effortless Scenario Analysis: Explore various assumptions and assess different outcomes with ease.
- Efficiency Booster: Remove the hassle of constructing intricate valuation models from the ground up.
How It Works
- Download the Template: Gain immediate access to the Excel-based BLUE DCF Calculator.
- Input Your Assumptions: Modify the yellow-highlighted cells for growth rates, WACC, margins, and more.
- Instant Calculations: The model automatically recalculates bluebird bio, Inc.’s intrinsic value.
- Test Scenarios: Experiment with various assumptions to assess potential changes in valuation.
- Analyze and Decide: Utilize the results to inform your investment or financial analysis.
Why Choose bluebird bio, Inc. (BLUE)?
- Innovative Solutions: Pioneering gene therapies that address serious genetic diseases.
- Proven Expertise: Backed by a team of leading scientists and industry professionals.
- Patient-Centric Approach: Focused on improving patient outcomes and quality of life.
- Robust Pipeline: A diverse range of therapies in various stages of development.
- Strong Community Impact: Committed to engaging with patients and advocacy groups.
Who Should Use This Product?
- Biotech Students: Explore gene therapy techniques and apply them with real-world data.
- Researchers: Integrate advanced models into your studies or clinical research.
- Investors: Validate your investment strategies and evaluate valuation metrics for bluebird bio, Inc. (BLUE).
- Market Analysts: Enhance your analysis with a customizable financial model tailored for biotech companies.
- Healthcare Entrepreneurs: Understand how leading biotech firms like bluebird bio, Inc. (BLUE) are assessed in the market.
What the Template Contains
- Preloaded BLUE Data: Historical and projected financial data, including revenue, EBIT, and capital expenditures.
- DCF and WACC Models: Professional-grade sheets for calculating intrinsic value and Weighted Average Cost of Capital.
- Editable Inputs: Yellow-highlighted cells for adjusting revenue growth, tax rates, and discount rates.
- Financial Statements: Comprehensive annual and quarterly financials for deeper analysis.
- Key Ratios: Profitability, leverage, and efficiency ratios to evaluate performance.
- Dashboard and Charts: Visual summaries of valuation outcomes and assumptions.
Disclaimer
All information, articles, and product details provided on this website are for general informational and educational purposes only. We do not claim any ownership over, nor do we intend to infringe upon, any trademarks, copyrights, logos, brand names, or other intellectual property mentioned or depicted on this site. Such intellectual property remains the property of its respective owners, and any references here are made solely for identification or informational purposes, without implying any affiliation, endorsement, or partnership.
We make no representations or warranties, express or implied, regarding the accuracy, completeness, or suitability of any content or products presented. Nothing on this website should be construed as legal, tax, investment, financial, medical, or other professional advice. In addition, no part of this site—including articles or product references—constitutes a solicitation, recommendation, endorsement, advertisement, or offer to buy or sell any securities, franchises, or other financial instruments, particularly in jurisdictions where such activity would be unlawful.
All content is of a general nature and may not address the specific circumstances of any individual or entity. It is not a substitute for professional advice or services. Any actions you take based on the information provided here are strictly at your own risk. You accept full responsibility for any decisions or outcomes arising from your use of this website and agree to release us from any liability in connection with your use of, or reliance upon, the content or products found herein.