
|
Blue Star Limited (Bluestarco.NS) DCF Avaliação |
Totalmente Editável: Adapte-Se Às Suas Necessidades No Excel Ou Planilhas
Design Profissional: Modelos Confiáveis E Padrão Da Indústria
Pré-Construídos Para Uso Rápido E Eficiente
Compatível com MAC/PC, totalmente desbloqueado
Não É Necessária Experiência; Fácil De Seguir
Blue Star Limited (BLUESTARCO.NS) Bundle
Descubra o verdadeiro potencial da Blue Star Limited (Bluestarcons) com nossa calculadora DCF avançada! Personalize suposições essenciais, explore vários cenários e avalie os efeitos das mudanças na avaliação Blue Star Limited (Bluestarcons) - tudo em um modelo conveniente do Excel.
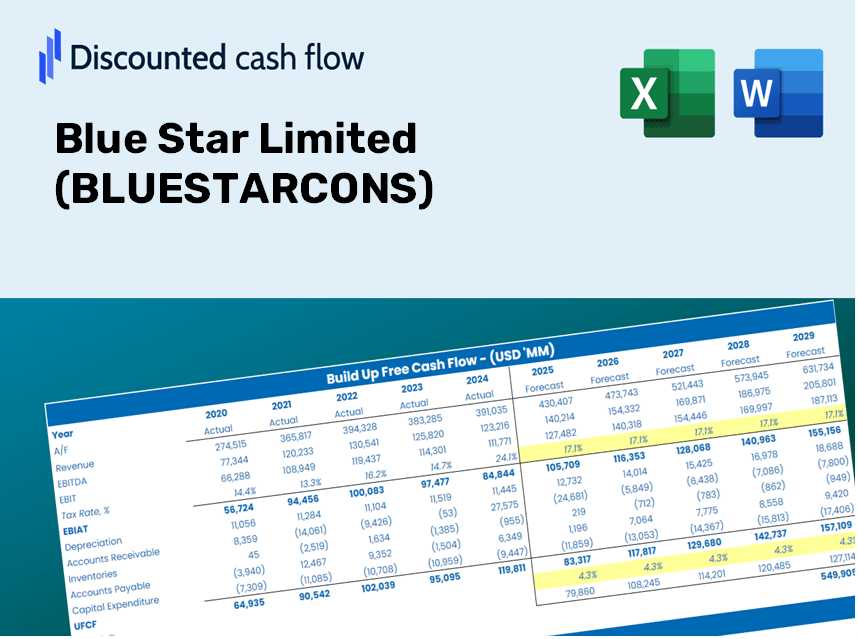
Discounted Cash Flow (DCF) - (USD MM)
| Year | AY1 2021 |
AY2 2022 |
AY3 2023 |
AY4 2024 |
AY5 2025 |
FY1 2026 |
FY2 2027 |
FY3 2028 |
FY4 2029 |
FY5 2030 |
|---|---|---|---|---|---|---|---|---|---|---|
| Revenue | 42,712.8 | 60,640.8 | 79,773.2 | 96,853.6 | 119,676.5 | 155,130.4 | 201,087.6 | 260,659.4 | 337,879.2 | 437,975.4 |
| Revenue Growth, % | 0 | 41.97 | 31.55 | 21.41 | 23.56 | 29.62 | 29.62 | 29.62 | 29.62 | 29.62 |
| EBITDA | 2,276.5 | 3,265.0 | 4,500.9 | 6,282.2 | 8,229.2 | 9,220.5 | 11,952.1 | 15,492.8 | 20,082.6 | 26,032.0 |
| EBITDA, % | 5.33 | 5.38 | 5.64 | 6.49 | 6.88 | 5.94 | 5.94 | 5.94 | 5.94 | 5.94 |
| Depreciation | 619.0 | 562.9 | 541.8 | 683.0 | 917.5 | 1,405.0 | 1,821.2 | 2,360.8 | 3,060.2 | 3,966.7 |
| Depreciation, % | 1.45 | 0.92825 | 0.67918 | 0.70519 | 0.76665 | 0.9057 | 0.9057 | 0.9057 | 0.9057 | 0.9057 |
| EBIT | 1,657.5 | 2,702.1 | 3,959.1 | 5,599.2 | 7,311.7 | 7,815.5 | 10,130.8 | 13,132.1 | 17,022.4 | 22,065.3 |
| EBIT, % | 3.88 | 4.46 | 4.96 | 5.78 | 6.11 | 5.04 | 5.04 | 5.04 | 5.04 | 5.04 |
| Total Cash | 6,069.9 | 4,106.8 | 3,692.3 | 6,225.6 | 8,423.3 | 12,124.4 | 15,716.2 | 20,372.1 | 26,407.3 | 34,230.4 |
| Total Cash, percent | .0 | .0 | .0 | .0 | .0 | .0 | .0 | .0 | .0 | .0 |
| Account Receivables | 12,210.8 | 17,192.3 | 21,984.8 | 27,570.4 | 27,964.2 | 42,298.1 | 54,828.9 | 71,071.8 | 92,126.7 | 119,419.1 |
| Account Receivables, % | 28.59 | 28.35 | 27.56 | 28.47 | 23.37 | 27.27 | 27.27 | 27.27 | 27.27 | 27.27 |
| Inventories | 8,824.2 | 11,442.4 | 14,333.9 | 14,071.8 | 21,491.5 | 27,918.4 | 36,189.2 | 46,910.2 | 60,807.3 | 78,821.4 |
| Inventories, % | 20.66 | 18.87 | 17.97 | 14.53 | 17.96 | 18 | 18 | 18 | 18 | 18 |
| Accounts Payable | 16,048.9 | 20,416.7 | 25,111.6 | 26,166.0 | 34,276.2 | 49,138.4 | 63,695.6 | 82,565.3 | 107,025.1 | 138,731.1 |
| Accounts Payable, % | 37.57 | 33.67 | 31.48 | 27.02 | 28.64 | 31.68 | 31.68 | 31.68 | 31.68 | 31.68 |
| Capital Expenditure | -635.2 | -2,179.4 | -3,603.6 | -4,409.6 | -3,720.3 | -5,355.1 | -6,941.5 | -8,997.9 | -11,663.5 | -15,118.8 |
| Capital Expenditure, % | -1.49 | -3.59 | -4.52 | -4.55 | -3.11 | -3.45 | -3.45 | -3.45 | -3.45 | -3.45 |
| Tax Rate, % | 24.68 | 24.68 | 24.68 | 24.68 | 24.68 | 24.68 | 24.68 | 24.68 | 24.68 | 24.68 |
| EBITAT | 1,125.8 | 1,806.2 | 2,854.7 | 4,170.1 | 5,507.5 | 5,575.1 | 7,226.7 | 9,367.6 | 12,142.7 | 15,739.9 |
| Depreciation | ||||||||||
| Changes in Account Receivables | ||||||||||
| Changes in Inventories | ||||||||||
| Changes in Accounts Payable | ||||||||||
| Capital Expenditure | ||||||||||
| UFCF | -3,876.5 | -3,042.2 | -3,196.2 | -3,825.6 | 3,001.4 | -4,273.7 | -4,138.0 | -5,363.8 | -6,952.8 | -9,012.6 |
| WACC, % | 4.7 | 4.7 | 4.71 | 4.71 | 4.71 | 4.71 | 4.71 | 4.71 | 4.71 | 4.71 |
| PV UFCF | ||||||||||
| SUM PV UFCF | -25,472.3 | |||||||||
| Long Term Growth Rate, % | 4.00 | |||||||||
| Free cash flow (T + 1) | -9,373 | |||||||||
| Terminal Value | -1,322,594 | |||||||||
| Present Terminal Value | -1,050,783 | |||||||||
| Enterprise Value | -1,076,255 | |||||||||
| Net Debt | -446 | |||||||||
| Equity Value | -1,075,809 | |||||||||
| Diluted Shares Outstanding, MM | 199 | |||||||||
| Equity Value Per Share | -5,394.12 |
What You'll Receive
- Pre-Populated Financial Model: Utilize Blue Star Limited's (BLUESTARCONS) actual data for accurate DCF valuation.
- Comprehensive Forecast Control: Modify revenue growth, profit margins, WACC, and other critical factors.
- Real-Time Calculations: Automatic updates ensure immediate visibility of changes as you adjust inputs.
- Professional-Grade Template: A polished Excel file crafted for high-quality valuation presentations.
- Flexible and Reusable: Designed for adaptability, enabling repeated use for in-depth forecasting.
Key Features
- Comprehensive BLUESTARCONS Data: Features Apple’s historical financials alongside future projections for Blue Star Limited.
- Fully Customizable Parameters: Tailor revenue growth rates, profit margins, WACC, tax rates, and capital expenditure settings.
- Dynamic Valuation Framework: Real-time updates to Net Present Value (NPV) and intrinsic value based on your specified parameters.
- Scenario Analysis: Generate various forecast scenarios to evaluate different valuation possibilities.
- Intuitive User Interface: Designed to be clear and accessible for both seasoned professionals and newcomers.
How It Operates
- Step 1: Download the Excel file.
- Step 2: Review the pre-filled data for Blue Star Limited (BLUESTARCONS) including both historical and forecasted figures.
- Step 3: Modify key assumptions (highlighted in yellow) based on your insights.
- Step 4: Observe automatic recalculations for the intrinsic value of Blue Star Limited (BLUESTARCONS).
- Step 5: Utilize the results for investment strategies or reporting purposes.
Why Choose the Blue Star Limited Calculator?
- All-in-One Solution: Offers DCF, WACC, and financial ratio analyses all in one convenient tool.
- Flexible Configurations: Modify yellow-highlighted fields to explore various financial scenarios.
- In-Depth Analysis: Automatically computes the intrinsic value and Net Present Value for Blue Star Limited (BLUESTARCONS).
- Integrated Data: Comes with historical and projected data for reliable starting points.
- High-Quality Standards: Perfectly suited for financial analysts, investors, and business advisers.
Who Can Benefit from Blue Star Limited (BLUESTARCONS)?
- Professional Investors: Create comprehensive and dependable valuation models for portfolio assessment.
- Corporate Finance Teams: Evaluate valuation scenarios to inform strategic decisions.
- Consultants and Advisors: Deliver precise valuation insights for Blue Star Limited (BLUESTARCONS) to clients.
- Students and Educators: Leverage real-world data for practicing and teaching financial modeling techniques.
- Tech Enthusiasts: Gain insight into how technology companies like Blue Star Limited (BLUESTARCONS) are appraised in the market.
Contents of the Template
- Preloaded BLUESTAR Data: Historical and forecasted financial information, featuring revenue, EBIT, and capital expenditures.
- DCF and WACC Models: High-quality spreadsheets designed for computing intrinsic value and Weighted Average Cost of Capital.
- Editable Inputs: Cells highlighted in yellow for modifying revenue growth, tax rates, and discount rates.
- Financial Statements: Detailed annual and quarterly financial reports for thorough analysis.
- Key Ratios: Metrics on profitability, leverage, and efficiency to assess performance.
- Dashboard and Charts: Visual representations of valuation results and underlying assumptions.
Disclaimer
All information, articles, and product details provided on this website are for general informational and educational purposes only. We do not claim any ownership over, nor do we intend to infringe upon, any trademarks, copyrights, logos, brand names, or other intellectual property mentioned or depicted on this site. Such intellectual property remains the property of its respective owners, and any references here are made solely for identification or informational purposes, without implying any affiliation, endorsement, or partnership.
We make no representations or warranties, express or implied, regarding the accuracy, completeness, or suitability of any content or products presented. Nothing on this website should be construed as legal, tax, investment, financial, medical, or other professional advice. In addition, no part of this site—including articles or product references—constitutes a solicitation, recommendation, endorsement, advertisement, or offer to buy or sell any securities, franchises, or other financial instruments, particularly in jurisdictions where such activity would be unlawful.
All content is of a general nature and may not address the specific circumstances of any individual or entity. It is not a substitute for professional advice or services. Any actions you take based on the information provided here are strictly at your own risk. You accept full responsibility for any decisions or outcomes arising from your use of this website and agree to release us from any liability in connection with your use of, or reliance upon, the content or products found herein.