
|
BackBlaze, Inc. (Blze) Avaliação DCF |
Totalmente Editável: Adapte-Se Às Suas Necessidades No Excel Ou Planilhas
Design Profissional: Modelos Confiáveis E Padrão Da Indústria
Pré-Construídos Para Uso Rápido E Eficiente
Compatível com MAC/PC, totalmente desbloqueado
Não É Necessária Experiência; Fácil De Seguir
Backblaze, Inc. (BLZE) Bundle
Descubra o verdadeiro potencial da Backblaze, Inc. (BLZE) com nossa calculadora DCF avançada! Ajuste as suposições essenciais, explore vários cenários e avalie como as flutuações influenciam a avaliação BackBlAze, Inc. (BLZE) - tudo dentro de um modelo conveniente do Excel.
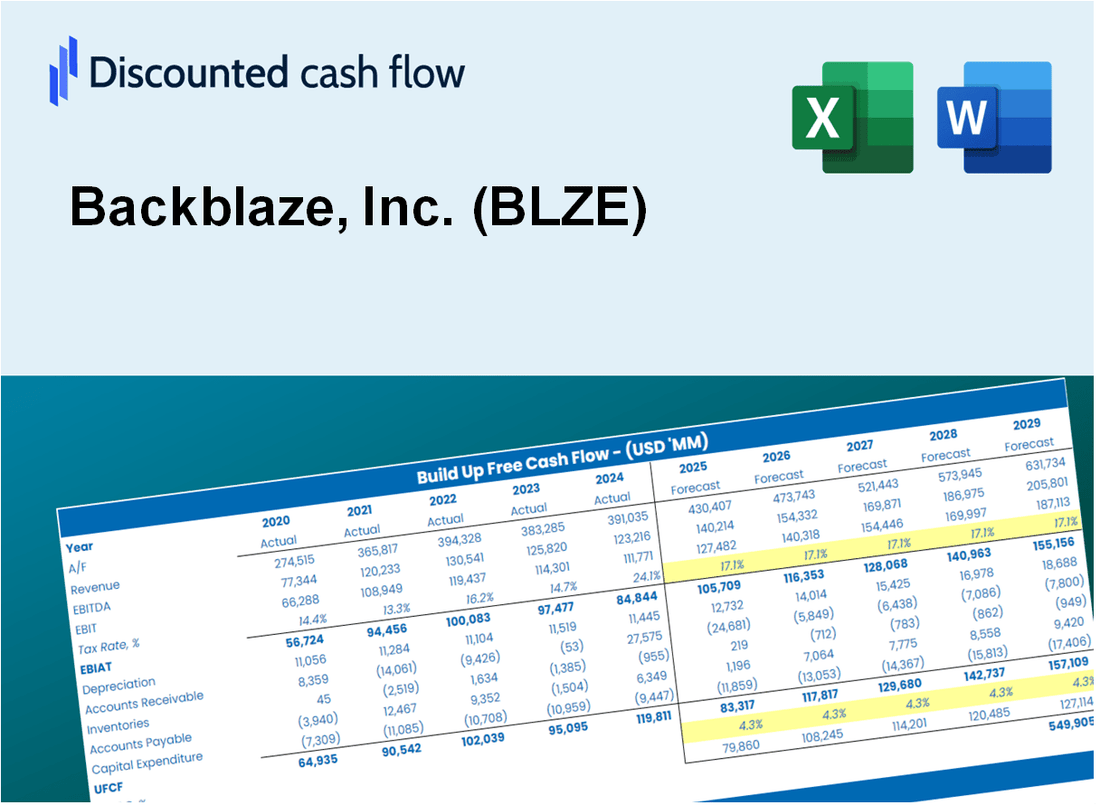
Discounted Cash Flow (DCF) - (USD MM)
| Year | AY1 2020 |
AY2 2021 |
AY3 2022 |
AY4 2023 |
AY5 2024 |
FY1 2025 |
FY2 2026 |
FY3 2027 |
FY4 2028 |
FY5 2029 |
|---|---|---|---|---|---|---|---|---|---|---|
| Revenue | 53.8 | 67.5 | 85.2 | 102.0 | 127.6 | 158.4 | 196.7 | 244.2 | 303.1 | 376.3 |
| Revenue Growth, % | 0 | 25.46 | 26.19 | 19.8 | 25.1 | 24.14 | 24.14 | 24.14 | 24.14 | 24.14 |
| EBITDA | 9.2 | -1.6 | -27.0 | -31.0 | -16.5 | -19.1 | -23.7 | -29.4 | -36.6 | -45.4 |
| EBITDA, % | 17.14 | -2.38 | -31.7 | -30.4 | -12.96 | -12.06 | -12.06 | -12.06 | -12.06 | -12.06 |
| Depreciation | 13.0 | 16.3 | 20.2 | 24.9 | 28.3 | 37.6 | 46.6 | 57.9 | 71.9 | 89.2 |
| Depreciation, % | 24.08 | 24.19 | 23.66 | 24.42 | 22.2 | 23.71 | 23.71 | 23.71 | 23.71 | 23.71 |
| EBIT | -3.7 | -17.9 | -47.1 | -55.9 | -44.9 | -56.7 | -70.4 | -87.3 | -108.4 | -134.6 |
| EBIT, % | -6.94 | -26.57 | -55.37 | -54.81 | -35.15 | -35.77 | -35.77 | -35.77 | -35.77 | -35.77 |
| Total Cash | 6.1 | 104.8 | 65.4 | 29.3 | 54.9 | 82.3 | 102.2 | 126.9 | 157.5 | 195.6 |
| Total Cash, percent | .0 | .0 | .0 | .0 | .0 | .0 | .0 | .0 | .0 | .0 |
| Account Receivables | 1.3 | 1.8 | 3.1 | 4.5 | 6.0 | 5.7 | 7.1 | 8.8 | 10.9 | 13.5 |
| Account Receivables, % | 2.45 | 2.69 | 3.68 | 4.36 | 4.73 | 3.59 | 3.59 | 3.59 | 3.59 | 3.59 |
| Inventories | .0 | .0 | .0 | .0 | .0 | .0 | .0 | .0 | .0 | .0 |
| Inventories, % | 0 | 0 | 0 | 0 | 0 | 0 | 0 | 0 | 0 | 0 |
| Accounts Payable | 1.7 | 2.1 | 3.3 | 2.0 | 1.5 | 4.2 | 5.2 | 6.4 | 8.0 | 9.9 |
| Accounts Payable, % | 3.18 | 3.08 | 3.86 | 1.93 | 1.14 | 2.64 | 2.64 | 2.64 | 2.64 | 2.64 |
| Capital Expenditure | -5.0 | -11.2 | -16.0 | -20.2 | -1.7 | -20.8 | -25.9 | -32.1 | -39.9 | -49.5 |
| Capital Expenditure, % | -9.25 | -16.58 | -18.77 | -19.83 | -1.34 | -13.15 | -13.15 | -13.15 | -13.15 | -13.15 |
| Tax Rate, % | -0.01236476 | -0.01236476 | -0.01236476 | -0.01236476 | -0.01236476 | -0.01236476 | -0.01236476 | -0.01236476 | -0.01236476 | -0.01236476 |
| EBITAT | -3.7 | -18.0 | -47.1 | -55.9 | -44.9 | -56.7 | -70.3 | -87.3 | -108.4 | -134.6 |
| Depreciation | ||||||||||
| Changes in Account Receivables | ||||||||||
| Changes in Inventories | ||||||||||
| Changes in Accounts Payable | ||||||||||
| Capital Expenditure | ||||||||||
| UFCF | 4.6 | -13.0 | -43.1 | -53.9 | -20.4 | -36.9 | -49.9 | -62.0 | -77.0 | -95.6 |
| WACC, % | 9.28 | 9.28 | 9.28 | 9.28 | 9.28 | 9.28 | 9.28 | 9.28 | 9.28 | 9.28 |
| PV UFCF | ||||||||||
| SUM PV UFCF | -238.3 | |||||||||
| Long Term Growth Rate, % | 2.00 | |||||||||
| Free cash flow (T + 1) | -97 | |||||||||
| Terminal Value | -1,338 | |||||||||
| Present Terminal Value | -859 | |||||||||
| Enterprise Value | -1,097 | |||||||||
| Net Debt | 1 | |||||||||
| Equity Value | -1,097 | |||||||||
| Diluted Shares Outstanding, MM | 44 | |||||||||
| Equity Value Per Share | -25.20 |
What You Will Get
- Real Backblaze Data: Preloaded financials – from revenue to EBIT – based on actual and projected figures.
- Full Customization: Adjust all critical parameters (yellow cells) like WACC, growth %, and tax rates.
- Instant Valuation Updates: Automatic recalculations to analyze the impact of changes on Backblaze’s fair value.
- Versatile Excel Template: Tailored for quick edits, scenario testing, and detailed projections.
- Time-Saving and Accurate: Skip building models from scratch while maintaining precision and flexibility.
Key Features
- Pre-Loaded Data: Backblaze’s historical financial statements and pre-filled forecasts.
- Fully Adjustable Inputs: Edit WACC, tax rates, revenue growth, and EBITDA margins.
- Instant Results: See Backblaze’s intrinsic value recalculate in real time.
- Clear Visual Outputs: Dashboard charts display valuation results and key metrics.
- Built for Accuracy: A professional tool for analysts, investors, and finance experts.
How It Works
- Step 1: Download the Excel file.
- Step 2: Review pre-entered Backblaze data (historical and projected).
- Step 3: Adjust key assumptions (yellow cells) based on your analysis.
- Step 4: View automatic recalculations for Backblaze’s intrinsic value.
- Step 5: Use the outputs for investment decisions or reporting.
Why Choose Backblaze Calculator?
- All-in-One Solution: Features cloud storage analysis, backup solutions, and cost projections in a single platform.
- Flexible Parameters: Modify highlighted fields to explore different backup and storage scenarios.
- In-Depth Analysis: Automatically computes Backblaze’s market value and potential savings.
- Preloaded Metrics: Historical usage data and pricing models provide reliable benchmarks.
- Expert-Level Tool: Perfect for IT professionals, data managers, and tech consultants.
Who Should Use Backblaze, Inc. (BLZE)?
- Small Business Owners: Safeguard your data with reliable and affordable cloud storage solutions.
- IT Professionals: Streamline backup processes with an easy-to-use platform that integrates seamlessly.
- Content Creators: Ensure your valuable files are secure and accessible from anywhere.
- Tech Enthusiasts: Explore innovative storage solutions and stay updated on the latest in cloud technology.
- Students and Educators: Utilize Backblaze as a case study in cloud computing and data management courses.
What the Template Contains
- Operating and Balance Sheet Data: Pre-filled Backblaze historical data and forecasts, including revenue, EBITDA, EBIT, and capital expenditures.
- WACC Calculation: A dedicated sheet for Weighted Average Cost of Capital (WACC), including parameters like Beta, risk-free rate, and share price.
- DCF Valuation (Unlevered and Levered): Editable Discounted Cash Flow models showing intrinsic value with detailed calculations.
- Financial Statements: Pre-loaded financial statements (annual and quarterly) to support analysis.
- Key Ratios: Includes profitability, leverage, and efficiency ratios for Backblaze, Inc. (BLZE).
- Dashboard and Charts: Visual summary of valuation outputs and assumptions to analyze results easily.
Disclaimer
All information, articles, and product details provided on this website are for general informational and educational purposes only. We do not claim any ownership over, nor do we intend to infringe upon, any trademarks, copyrights, logos, brand names, or other intellectual property mentioned or depicted on this site. Such intellectual property remains the property of its respective owners, and any references here are made solely for identification or informational purposes, without implying any affiliation, endorsement, or partnership.
We make no representations or warranties, express or implied, regarding the accuracy, completeness, or suitability of any content or products presented. Nothing on this website should be construed as legal, tax, investment, financial, medical, or other professional advice. In addition, no part of this site—including articles or product references—constitutes a solicitation, recommendation, endorsement, advertisement, or offer to buy or sell any securities, franchises, or other financial instruments, particularly in jurisdictions where such activity would be unlawful.
All content is of a general nature and may not address the specific circumstances of any individual or entity. It is not a substitute for professional advice or services. Any actions you take based on the information provided here are strictly at your own risk. You accept full responsibility for any decisions or outcomes arising from your use of this website and agree to release us from any liability in connection with your use of, or reliance upon, the content or products found herein.