
|
Benitec Biopharma Inc. (BNTC) DCF Avaliação |
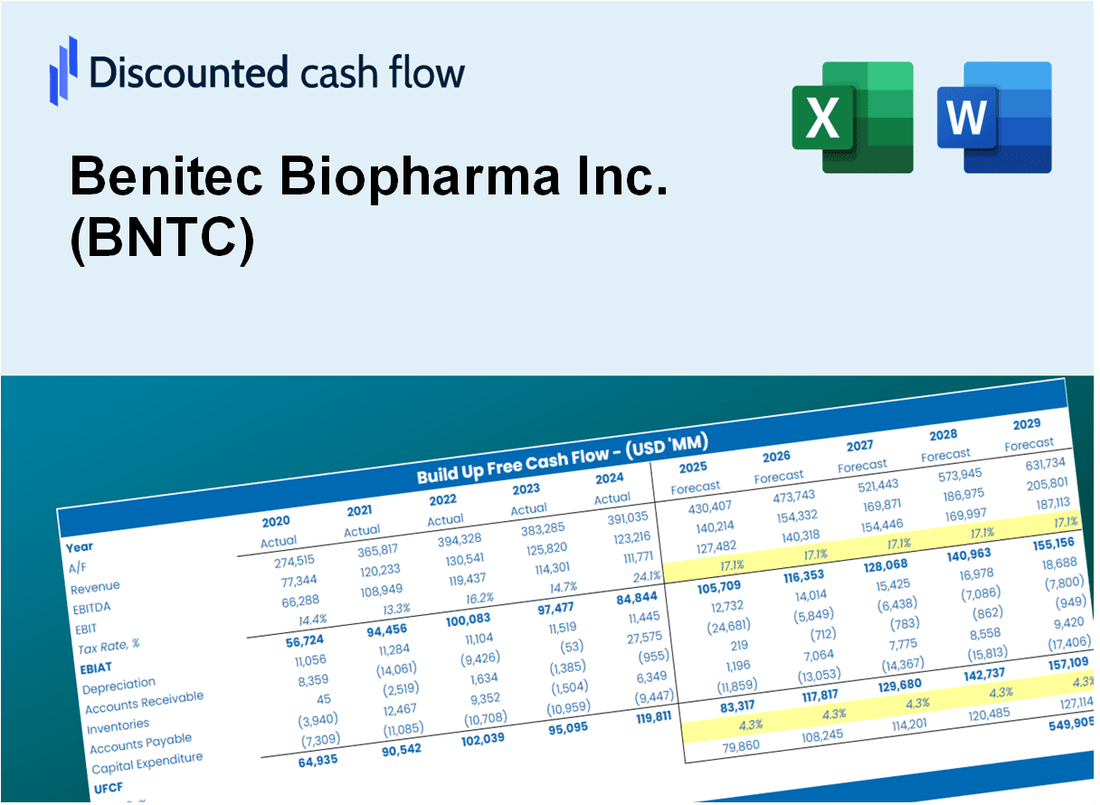
Totalmente Editável: Adapte-Se Às Suas Necessidades No Excel Ou Planilhas
Design Profissional: Modelos Confiáveis E Padrão Da Indústria
Pré-Construídos Para Uso Rápido E Eficiente
Compatível com MAC/PC, totalmente desbloqueado
Não É Necessária Experiência; Fácil De Seguir
Benitec Biopharma Inc. (BNTC) Bundle
Faça escolhas de investimento informadas com a calculadora Benitec Biopharma Inc. (BNTC) DCF! Explore dados financeiros genuínos da Benitec, ajuste as projeções e despesas de crescimento e observe instantaneamente como essas modificações afetam o valor intrínseco da Benitec Biopharma Inc. (BNTC).
What You Will Get
- Real BNTC Financial Data: Pre-filled with Benitec Biopharma's historical and projected data for precise analysis.
- Fully Editable Template: Modify key inputs like revenue growth, WACC, and EBITDA % with ease.
- Automatic Calculations: See Benitec Biopharma’s intrinsic value update instantly based on your changes.
- Professional Valuation Tool: Designed for investors, analysts, and consultants seeking accurate DCF results.
- User-Friendly Design: Simple structure and clear instructions for all experience levels.
Key Features
- Comprehensive Data: Benitec Biopharma’s historical financial statements and pre-filled projections.
- Customizable Inputs: Modify WACC, tax rates, revenue growth, and EBITDA margins as needed.
- Real-Time Results: Observe Benitec Biopharma’s intrinsic value recalibrating instantly.
- Intuitive Visual Outputs: Dashboard graphs illustrate valuation results and essential metrics.
- Designed for Precision: A professional-grade tool for analysts, investors, and finance professionals.
How It Works
- Download: Get the pre-built Excel file containing Benitec Biopharma Inc.'s (BNTC) financial data.
- Customize: Modify projections, such as revenue growth, EBITDA %, and WACC.
- Update Automatically: Watch as intrinsic value and NPV calculations refresh in real-time.
- Test Scenarios: Generate various forecasts and instantly compare the results.
- Make Decisions: Leverage the valuation findings to inform your investment approach.
Why Choose This Calculator for Benitec Biopharma Inc. (BNTC)?
- Accurate Data: Utilize real Benitec Biopharma financials for dependable valuation outcomes.
- Customizable: Modify essential parameters such as growth rates, WACC, and tax rates to align with your forecasts.
- Time-Saving: Pre-configured calculations streamline your process, saving you time.
- Professional-Grade Tool: Tailored for investors, analysts, and consultants in the biotech sector.
- User-Friendly: Designed with an intuitive interface and clear instructions to accommodate users of all levels.
Who Should Use This Product?
- Investors: Assess the fair value of Benitec Biopharma Inc. (BNTC) to inform investment strategies.
- CFOs: Utilize a comprehensive DCF model for accurate financial reporting and analysis.
- Consultants: Easily modify the template for client valuation reports specific to Benitec Biopharma Inc. (BNTC).
- Entrepreneurs: Understand financial modeling techniques applied by leading biotech firms.
- Educators: Employ this resource as a teaching aid to illustrate valuation approaches in biotech.
What the Template Contains
- Pre-Filled DCF Model: Benitec Biopharma Inc.'s (BNTC) financial data preloaded for immediate use.
- WACC Calculator: Detailed calculations for Weighted Average Cost of Capital specific to Benitec Biopharma Inc. (BNTC).
- Financial Ratios: Assess Benitec Biopharma Inc.'s (BNTC) profitability, leverage, and efficiency metrics.
- Editable Inputs: Modify assumptions like growth rates, margins, and CAPEX to suit your analysis for Benitec Biopharma Inc. (BNTC).
- Financial Statements: Access annual and quarterly reports for comprehensive evaluation of Benitec Biopharma Inc. (BNTC).
- Interactive Dashboard: Effortlessly visualize key valuation metrics and outcomes for Benitec Biopharma Inc. (BNTC).
Disclaimer
All information, articles, and product details provided on this website are for general informational and educational purposes only. We do not claim any ownership over, nor do we intend to infringe upon, any trademarks, copyrights, logos, brand names, or other intellectual property mentioned or depicted on this site. Such intellectual property remains the property of its respective owners, and any references here are made solely for identification or informational purposes, without implying any affiliation, endorsement, or partnership.
We make no representations or warranties, express or implied, regarding the accuracy, completeness, or suitability of any content or products presented. Nothing on this website should be construed as legal, tax, investment, financial, medical, or other professional advice. In addition, no part of this site—including articles or product references—constitutes a solicitation, recommendation, endorsement, advertisement, or offer to buy or sell any securities, franchises, or other financial instruments, particularly in jurisdictions where such activity would be unlawful.
All content is of a general nature and may not address the specific circumstances of any individual or entity. It is not a substitute for professional advice or services. Any actions you take based on the information provided here are strictly at your own risk. You accept full responsibility for any decisions or outcomes arising from your use of this website and agree to release us from any liability in connection with your use of, or reliance upon, the content or products found herein.