
|
BridgePoint Group plc (bpt.l) Avaliação DCF |
Totalmente Editável: Adapte-Se Às Suas Necessidades No Excel Ou Planilhas
Design Profissional: Modelos Confiáveis E Padrão Da Indústria
Pré-Construídos Para Uso Rápido E Eficiente
Compatível com MAC/PC, totalmente desbloqueado
Não É Necessária Experiência; Fácil De Seguir
Bridgepoint Group plc (BPT.L) Bundle
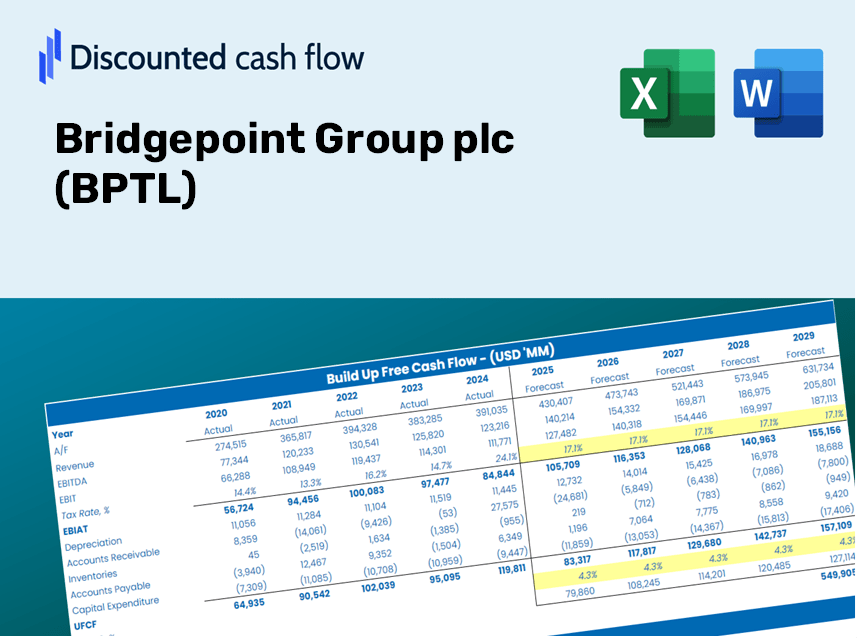
Simplifique a avaliação do BridgePoint Group PLC (BPTL) com esta calculadora DCF personalizável! Com o Real BridgePoint Group Plc (BPTL) financeiras e insumos de previsão ajustáveis, você pode testar cenários e descobrir o valor justo do BridgePoint Group Plc (BPTL) em minutos.
Discounted Cash Flow (DCF) - (USD MM)
| Year | AY1 2020 |
AY2 2021 |
AY3 2022 |
AY4 2023 |
AY5 2024 |
FY1 2025 |
FY2 2026 |
FY3 2027 |
FY4 2028 |
FY5 2029 |
|---|---|---|---|---|---|---|---|---|---|---|
| Revenue | 190.9 | 270.6 | 313.7 | 320.6 | 388.3 | 466.9 | 561.4 | 675.0 | 811.7 | 976.0 |
| Revenue Growth, % | 0 | 41.72 | 15.93 | 2.2 | 21.12 | 20.24 | 20.24 | 20.24 | 20.24 | 20.24 |
| EBITDA | 66.6 | 112.8 | 139.2 | 143.7 | 138.0 | 188.0 | 226.0 | 271.8 | 326.8 | 392.9 |
| EBITDA, % | 34.88 | 41.69 | 44.37 | 44.82 | 35.54 | 40.26 | 40.26 | 40.26 | 40.26 | 40.26 |
| Depreciation | 8.8 | 15.0 | 18.3 | 18.7 | 36.2 | 29.1 | 35.0 | 42.0 | 50.6 | 60.8 |
| Depreciation, % | 4.61 | 5.54 | 5.83 | 5.83 | 9.32 | 6.23 | 6.23 | 6.23 | 6.23 | 6.23 |
| EBIT | 57.8 | 97.8 | 120.9 | 125.0 | 101.8 | 158.9 | 191.1 | 229.7 | 276.2 | 332.1 |
| EBIT, % | 30.27 | 36.14 | 38.54 | 38.99 | 26.22 | 34.03 | 34.03 | 34.03 | 34.03 | 34.03 |
| Total Cash | 429.6 | 609.9 | 1,061.9 | 1,595.1 | 2,069.0 | 466.9 | 561.4 | 675.0 | 811.7 | 976.0 |
| Total Cash, percent | .0 | .0 | .0 | .0 | .0 | .0 | .0 | .0 | .0 | .0 |
| Account Receivables | 13.1 | 76.8 | 125.9 | 17.5 | 125.8 | 105.7 | 127.1 | 152.9 | 183.8 | 221.0 |
| Account Receivables, % | 6.86 | 28.38 | 40.13 | 5.46 | 32.4 | 22.65 | 22.65 | 22.65 | 22.65 | 22.65 |
| Inventories | .0 | .0 | .0 | -20.7 | .0 | -6.0 | -7.2 | -8.7 | -10.5 | -12.6 |
| Inventories, % | 0 | 0 | 0 | -6.46 | 0 | -1.29 | -1.29 | -1.29 | -1.29 | -1.29 |
| Accounts Payable | 98.3 | 8.0 | 121.9 | 185.9 | 233.7 | 197.5 | 237.4 | 285.5 | 343.3 | 412.8 |
| Accounts Payable, % | 51.48 | 2.96 | 38.86 | 57.99 | 60.19 | 42.29 | 42.29 | 42.29 | 42.29 | 42.29 |
| Capital Expenditure | -3.2 | -6.3 | -22.6 | -4.0 | -2.9 | -12.3 | -14.8 | -17.8 | -21.5 | -25.8 |
| Capital Expenditure, % | -1.69 | -2.33 | -7.2 | -1.25 | -0.74685 | -2.64 | -2.64 | -2.64 | -2.64 | -2.64 |
| Tax Rate, % | 19.7 | 19.7 | 19.7 | 19.7 | 19.7 | 19.7 | 19.7 | 19.7 | 19.7 | 19.7 |
| EBITAT | 43.5 | 90.3 | 114.4 | 102.8 | 81.7 | 135.0 | 162.3 | 195.2 | 234.7 | 282.2 |
| Depreciation | ||||||||||
| Changes in Account Receivables | ||||||||||
| Changes in Inventories | ||||||||||
| Changes in Accounts Payable | ||||||||||
| Capital Expenditure | ||||||||||
| UFCF | 134.3 | -55.0 | 174.9 | 310.6 | 33.8 | 141.6 | 202.2 | 243.2 | 292.4 | 351.6 |
| WACC, % | 7.55 | 7.81 | 7.85 | 7.65 | 7.62 | 7.7 | 7.7 | 7.7 | 7.7 | 7.7 |
| PV UFCF | ||||||||||
| SUM PV UFCF | 960.5 | |||||||||
| Long Term Growth Rate, % | 2.00 | |||||||||
| Free cash flow (T + 1) | 359 | |||||||||
| Terminal Value | 6,294 | |||||||||
| Present Terminal Value | 4,344 | |||||||||
| Enterprise Value | 5,304 | |||||||||
| Net Debt | 2,227 | |||||||||
| Equity Value | 3,078 | |||||||||
| Diluted Shares Outstanding, MM | 1,018 | |||||||||
| Equity Value Per Share | 302.45 |
What You Will Receive
- Authentic BPTL Financial Data: Pre-loaded with Bridgepoint Group plc’s historical and projected financial information for accurate analysis.
- Completely Customizable Template: Easily adjust essential inputs such as revenue growth, WACC, and EBITDA percentage.
- Instantaneous Calculations: Watch the intrinsic value of BPTL update in real-time as you modify inputs.
- Expert Valuation Tool: Tailored for investors, analysts, and consultants in search of precise DCF outcomes.
- Intuitive Design: A straightforward layout with clear guidance suitable for users of all experience levels.
Key Features
- Comprehensive DCF Calculator: Features detailed unlevered and levered DCF valuation models tailored for Bridgepoint Group plc (BPTL).
- WACC Calculator: Customizable Weighted Average Cost of Capital sheet designed for user-specific inputs.
- Adjustable Forecast Assumptions: Tailor growth rates, capital expenditures, and discount rates to fit your analysis needs.
- Integrated Financial Ratios: Evaluate profitability, leverage, and efficiency ratios specific to Bridgepoint Group plc (BPTL).
- Visual Dashboard and Charts: Graphical representations summarize essential valuation metrics for quick evaluation.
How It Functions
- Step 1: Download the ready-to-use Excel template containing data for Bridgepoint Group plc (BPTL).
- Step 2: Navigate through the pre-filled sheets to familiarize yourself with essential metrics.
- Step 3: Modify forecasts and assumptions in the editable yellow cells (WACC, growth, margins).
- Step 4: Instantly view updated results, including the intrinsic value of Bridgepoint Group plc (BPTL).
- Step 5: Make informed investment choices or create reports based on the outputs.
Why Choose the Bridgepoint Group plc (BPTL) Calculator?
- Precision: Utilize authentic Bridgepoint financial data for unparalleled accuracy.
- Versatility: Tailored for users to easily experiment with and modify their inputs.
- Efficiency: Avoid the complexities of constructing a DCF model from the ground up.
- Expert-Level: Crafted with the expertise and attention to detail expected at the CFO level.
- Intuitive: Simple to navigate, even for individuals with limited financial modeling knowledge.
Who Can Benefit from This Product?
- Professional Investors: Develop comprehensive and accurate valuation models for portfolio evaluation.
- Corporate Finance Teams: Assess valuation scenarios to inform strategic decisions.
- Consultants and Advisors: Deliver precise valuation insights for Bridgepoint Group plc (BPTL) to clients.
- Students and Educators: Utilize real-world data to enhance financial modeling skills and education.
- Finance Enthusiasts: Gain insights into how investment firms like Bridgepoint Group plc (BPTL) are valued in the financial landscape.
Contents of the Template
- Historical Data: Features Bridgepoint Group plc's (BPTL) previous financial performance and foundational forecasts.
- DCF and Levered DCF Models: Comprehensive templates designed to compute the intrinsic value of Bridgepoint Group plc (BPTL).
- WACC Sheet: Ready-to-use calculations for the Weighted Average Cost of Capital.
- Editable Inputs: Adjust essential drivers such as growth rates, EBITDA percentages, and CAPEX assumptions.
- Quarterly and Annual Statements: A thorough analysis of Bridgepoint Group plc's (BPTL) financial statements.
- Interactive Dashboard: Dynamically visualize valuation outcomes and forecasts.
Disclaimer
All information, articles, and product details provided on this website are for general informational and educational purposes only. We do not claim any ownership over, nor do we intend to infringe upon, any trademarks, copyrights, logos, brand names, or other intellectual property mentioned or depicted on this site. Such intellectual property remains the property of its respective owners, and any references here are made solely for identification or informational purposes, without implying any affiliation, endorsement, or partnership.
We make no representations or warranties, express or implied, regarding the accuracy, completeness, or suitability of any content or products presented. Nothing on this website should be construed as legal, tax, investment, financial, medical, or other professional advice. In addition, no part of this site—including articles or product references—constitutes a solicitation, recommendation, endorsement, advertisement, or offer to buy or sell any securities, franchises, or other financial instruments, particularly in jurisdictions where such activity would be unlawful.
All content is of a general nature and may not address the specific circumstances of any individual or entity. It is not a substitute for professional advice or services. Any actions you take based on the information provided here are strictly at your own risk. You accept full responsibility for any decisions or outcomes arising from your use of this website and agree to release us from any liability in connection with your use of, or reliance upon, the content or products found herein.