
|
Breedon Group Plc (Bree.L) Avaliação DCF |
Totalmente Editável: Adapte-Se Às Suas Necessidades No Excel Ou Planilhas
Design Profissional: Modelos Confiáveis E Padrão Da Indústria
Pré-Construídos Para Uso Rápido E Eficiente
Compatível com MAC/PC, totalmente desbloqueado
Não É Necessária Experiência; Fácil De Seguir
Breedon Group plc (BREE.L) Bundle
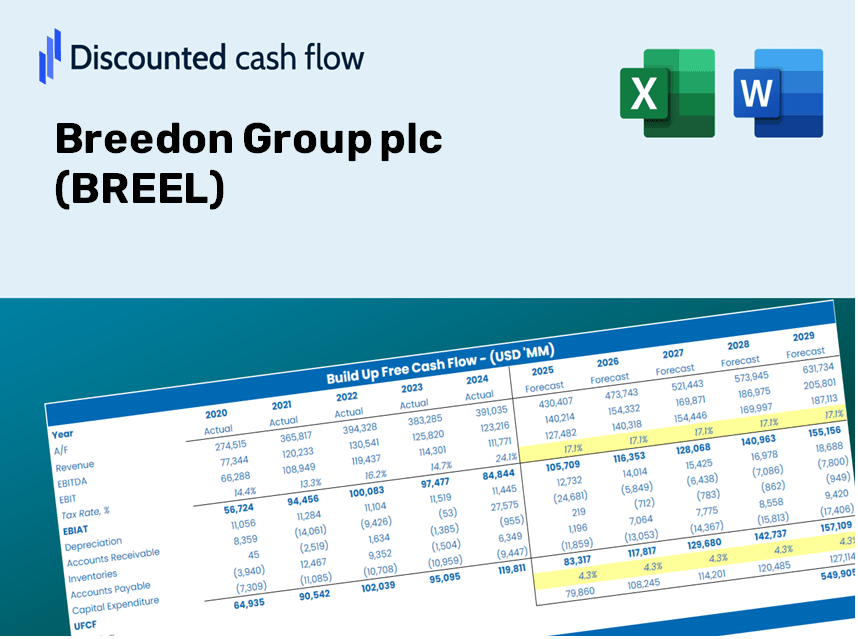
Simplifique a avaliação do Breedon Group PLC com esta calculadora DCF personalizável! Com o Real Breedon Group Plc Financials e os insumos de previsão ajustáveis, você pode testar cenários e descobrir o valor justo do Breedon Group PLC em minutos.
Discounted Cash Flow (DCF) - (USD MM)
| Year | AY1 2020 |
AY2 2021 |
AY3 2022 |
AY4 2023 |
AY5 2024 |
FY1 2025 |
FY2 2026 |
FY3 2027 |
FY4 2028 |
FY5 2029 |
|---|---|---|---|---|---|---|---|---|---|---|
| Revenue | 928.7 | 1,232.5 | 1,396.3 | 1,487.5 | 1,576.3 | 1,806.8 | 2,071.1 | 2,374.0 | 2,721.3 | 3,119.3 |
| Revenue Growth, % | 0 | 32.71 | 13.29 | 6.53 | 5.97 | 14.63 | 14.63 | 14.63 | 14.63 | 14.63 |
| EBITDA | 137.7 | 214.6 | 230.9 | 241.9 | 262.1 | 295.1 | 338.3 | 387.8 | 444.5 | 509.5 |
| EBITDA, % | 14.83 | 17.41 | 16.54 | 16.26 | 16.63 | 16.33 | 16.33 | 16.33 | 16.33 | 16.33 |
| Depreciation | 79.6 | 88.2 | 88.3 | 94.7 | 112.2 | 128.4 | 147.2 | 168.7 | 193.4 | 221.7 |
| Depreciation, % | 8.57 | 7.16 | 6.32 | 6.37 | 7.12 | 7.11 | 7.11 | 7.11 | 7.11 | 7.11 |
| EBIT | 58.1 | 126.4 | 142.6 | 147.2 | 149.9 | 166.7 | 191.1 | 219.0 | 251.1 | 287.8 |
| EBIT, % | 6.26 | 10.26 | 10.21 | 9.9 | 9.51 | 9.23 | 9.23 | 9.23 | 9.23 | 9.23 |
| Total Cash | 31.7 | 83.9 | 101.7 | 126.9 | 28.9 | 100.7 | 115.4 | 132.3 | 151.7 | 173.9 |
| Total Cash, percent | .0 | .0 | .0 | .0 | .0 | .0 | .0 | .0 | .0 | .0 |
| Account Receivables | 190.6 | 205.9 | 218.6 | 227.9 | 261.0 | 306.3 | 351.1 | 402.5 | 461.3 | 528.8 |
| Account Receivables, % | 20.52 | 16.71 | 15.66 | 15.32 | 16.56 | 16.95 | 16.95 | 16.95 | 16.95 | 16.95 |
| Inventories | 59.4 | 62.0 | 94.8 | 120.1 | 135.7 | 126.1 | 144.6 | 165.7 | 189.9 | 217.7 |
| Inventories, % | 6.4 | 5.03 | 6.79 | 8.07 | 8.61 | 6.98 | 6.98 | 6.98 | 6.98 | 6.98 |
| Accounts Payable | 111.3 | 142.4 | 161.4 | 145.2 | 151.7 | 196.9 | 225.7 | 258.7 | 296.5 | 339.9 |
| Accounts Payable, % | 11.98 | 11.55 | 11.56 | 9.76 | 9.62 | 10.9 | 10.9 | 10.9 | 10.9 | 10.9 |
| Capital Expenditure | -38.1 | -76.9 | -106.8 | -106.8 | -131.3 | -121.1 | -138.8 | -159.1 | -182.3 | -209.0 |
| Capital Expenditure, % | -4.1 | -6.24 | -7.65 | -7.18 | -8.33 | -6.7 | -6.7 | -6.7 | -6.7 | -6.7 |
| Tax Rate, % | 23.29 | 23.29 | 23.29 | 23.29 | 23.29 | 23.29 | 23.29 | 23.29 | 23.29 | 23.29 |
| EBITAT | 40.6 | 86.8 | 118.1 | 115.5 | 115.0 | 125.6 | 143.9 | 165.0 | 189.1 | 216.8 |
| Depreciation | ||||||||||
| Changes in Account Receivables | ||||||||||
| Changes in Inventories | ||||||||||
| Changes in Accounts Payable | ||||||||||
| Capital Expenditure | ||||||||||
| UFCF | -56.6 | 111.3 | 73.1 | 52.6 | 53.7 | 142.4 | 117.9 | 135.1 | 154.9 | 177.6 |
| WACC, % | 7.3 | 7.28 | 7.46 | 7.41 | 7.39 | 7.37 | 7.37 | 7.37 | 7.37 | 7.37 |
| PV UFCF | ||||||||||
| SUM PV UFCF | 585.1 | |||||||||
| Long Term Growth Rate, % | 3.00 | |||||||||
| Free cash flow (T + 1) | 183 | |||||||||
| Terminal Value | 4,188 | |||||||||
| Present Terminal Value | 2,935 | |||||||||
| Enterprise Value | 3,520 | |||||||||
| Net Debt | 405 | |||||||||
| Equity Value | 3,115 | |||||||||
| Diluted Shares Outstanding, MM | 344 | |||||||||
| Equity Value Per Share | 906.19 |
What You Will Receive
- Pre-Filled Financial Model: Utilize Breedon Group plc’s (BREEL) actual data for accurate DCF valuation.
- Comprehensive Forecast Control: Modify revenue growth, profit margins, WACC, and other critical variables.
- Real-Time Calculations: Automatic updates provide instant results as you make adjustments.
- Investor-Ready Template: A polished Excel file created for high-quality valuation purposes.
- Customizable and Reusable: Designed for adaptability, allowing for repeated application in detailed forecasts.
Key Features
- Comprehensive DCF Calculator: Offers both unlevered and levered DCF valuation models tailored for Breedon Group plc (BREEL).
- WACC Calculator: Features a pre-configured Weighted Average Cost of Capital sheet with options for input customization.
- Customizable Forecast Assumptions: Adjust growth rates, capital expenditures, and discount rates to fit your analysis.
- Integrated Financial Ratios: Evaluate profitability, leverage, and efficiency ratios specific to Breedon Group plc (BREEL).
- User-Friendly Dashboard and Charts: Visual summaries of essential valuation metrics facilitate straightforward analysis.
How It Works
- Step 1: Download the Excel file.
- Step 2: Examine Breedon Group plc’s (BREEL) pre-filled financial data and forecasts.
- Step 3: Adjust key inputs such as revenue growth, WACC, and tax rates (highlighted cells).
- Step 4: Observe the DCF model update in real-time as you modify your assumptions.
- Step 5: Evaluate the outputs and leverage the results for informed investment decisions.
Why Opt for the Breedon Group plc (BREEL) Calculator?
- Time Efficient: Jump straight in without the hassle of building a DCF model from the ground up.
- Enhanced Precision: Dependable financial data and formulas minimize inaccuracies in valuation.
- Completely Customizable: Adapt the model to align with your specific assumptions and forecasts.
- User-Friendly: Intuitive charts and outputs facilitate straightforward analysis of results.
- Endorsed by Professionals: Crafted for those who prioritize accuracy and ease of use.
Who Can Benefit from Breedon Group plc (BREEL)?
- Investors: Make informed decisions with our high-quality valuation tools tailored for the industry.
- Financial Analysts: Streamline your workflow with our customizable DCF models designed for efficiency.
- Consultants: Effortlessly modify templates for impactful client presentations or comprehensive reports.
- Finance Enthusiasts: Enhance your grasp of valuation methods through practical, real-world examples.
- Educators and Students: Utilize this resource as an effective tool for finance education and hands-on learning.
What the Template Includes
- Comprehensive DCF Model: An editable template featuring in-depth valuation calculations.
- Real-World Data: Breedon Group plc’s (BREEL) historical and projected financials preloaded for thorough analysis.
- Customizable Parameters: Modify WACC, growth rates, and tax assumptions to evaluate different scenarios.
- Financial Statements: Complete annual and quarterly breakdowns for enhanced insights.
- Key Ratios: Integrated analysis for assessing profitability, efficiency, and leverage.
- Dashboard with Visual Outputs: Charts and tables providing clear, actionable insights.
Disclaimer
All information, articles, and product details provided on this website are for general informational and educational purposes only. We do not claim any ownership over, nor do we intend to infringe upon, any trademarks, copyrights, logos, brand names, or other intellectual property mentioned or depicted on this site. Such intellectual property remains the property of its respective owners, and any references here are made solely for identification or informational purposes, without implying any affiliation, endorsement, or partnership.
We make no representations or warranties, express or implied, regarding the accuracy, completeness, or suitability of any content or products presented. Nothing on this website should be construed as legal, tax, investment, financial, medical, or other professional advice. In addition, no part of this site—including articles or product references—constitutes a solicitation, recommendation, endorsement, advertisement, or offer to buy or sell any securities, franchises, or other financial instruments, particularly in jurisdictions where such activity would be unlawful.
All content is of a general nature and may not address the specific circumstances of any individual or entity. It is not a substitute for professional advice or services. Any actions you take based on the information provided here are strictly at your own risk. You accept full responsibility for any decisions or outcomes arising from your use of this website and agree to release us from any liability in connection with your use of, or reliance upon, the content or products found herein.