
|
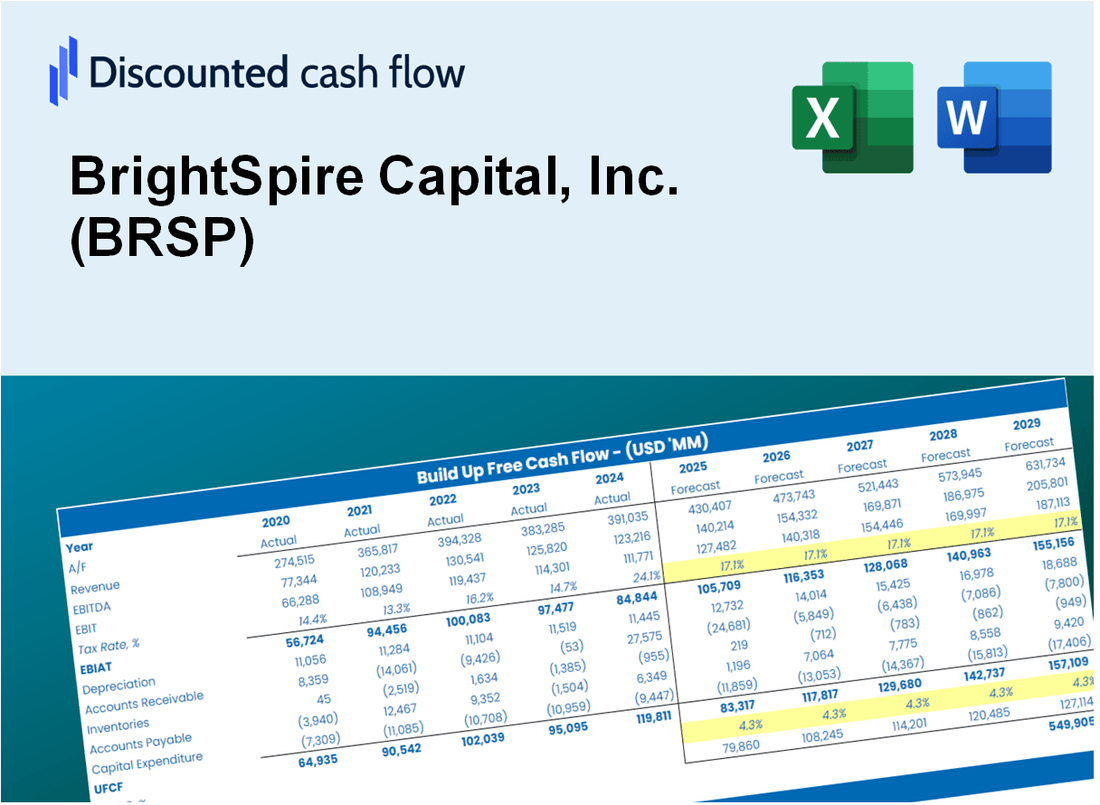
Avaliação DCF da Brightspire Capital, Inc. (BRSP) |
Totalmente Editável: Adapte-Se Às Suas Necessidades No Excel Ou Planilhas
Design Profissional: Modelos Confiáveis E Padrão Da Indústria
Pré-Construídos Para Uso Rápido E Eficiente
Compatível com MAC/PC, totalmente desbloqueado
Não É Necessária Experiência; Fácil De Seguir
BrightSpire Capital, Inc. (BRSP) Bundle
Descubra o verdadeiro potencial da BrightSire Capital, Inc. (BRSP) com nossa calculadora DCF avançada! Ajuste as principais premissas, explore vários cenários e avalie como as mudanças influenciam a avaliação do BrightSire Capital - tudo dentro de um modelo conveniente do Excel.
What You Will Get
- Real BRSP Financials: Access to historical and projected data for precise valuation.
- Customizable Inputs: Adjust WACC, tax rates, revenue growth, and capital expenditures as needed.
- Dynamic Calculations: Intrinsic value and NPV are computed automatically.
- Scenario Analysis: Evaluate multiple scenarios to assess BrightSpire’s future performance.
- User-Friendly Design: Crafted for professionals while remaining approachable for newcomers.
Key Features
- Comprehensive Financial Data: Gain access to precise historical performance and future forecasts for BrightSpire Capital, Inc. (BRSP).
- Tailored Forecast Parameters: Modify highlighted fields such as WACC, growth rates, and profit margins to suit your analysis.
- Real-Time Calculations: Enjoy automatic adjustments to DCF, Net Present Value (NPV), and cash flow evaluations.
- User-Friendly Dashboard: Intuitive charts and summaries that make it easy to interpret your valuation outcomes.
- Designed for All Levels: A straightforward, user-centric layout ideal for investors, CFOs, and consultants alike.
How It Works
- 1. Access the Template: Download and open the Excel file featuring BrightSpire Capital, Inc. (BRSP)'s preloaded data.
- 2. Modify Assumptions: Adjust essential inputs such as growth projections, WACC, and capital expenditures.
- 3. View Results Instantly: The DCF model automatically computes intrinsic value and NPV.
- 4. Explore Scenarios: Evaluate various forecasts to analyze different valuation scenarios.
- 5. Utilize with Assurance: Deliver professional valuation insights to enhance your decision-making process.
Why Choose This Calculator for BrightSpire Capital, Inc. (BRSP)?
- Accurate Data: Utilize real BrightSpire financials for dependable valuation outcomes.
- Customizable: Tailor essential parameters such as growth rates, WACC, and tax rates to fit your forecasts.
- Time-Saving: Pre-configured calculations save you the hassle of starting from the ground up.
- Professional-Grade Tool: Crafted for investors, analysts, and financial consultants.
- User-Friendly: Easy-to-navigate layout and clear step-by-step guidance make it accessible for all users.
Who Should Use This Product?
- Investors: Accurately assess BrightSpire Capital’s fair value before making investment choices.
- CFOs: Utilize a high-quality DCF model for financial reporting and in-depth analysis.
- Consultants: Easily customize the template for valuation reports tailored to clients.
- Entrepreneurs: Acquire knowledge of financial modeling practices employed by leading firms.
- Educators: Employ it as an instructional resource to illustrate valuation techniques.
What the Template Contains
- Preloaded BRSP Data: Historical and projected financial data, including revenue, EBIT, and capital expenditures.
- DCF and WACC Models: Professional-grade sheets for calculating intrinsic value and Weighted Average Cost of Capital.
- Editable Inputs: Yellow-highlighted cells for adjusting revenue growth, tax rates, and discount rates.
- Financial Statements: Comprehensive annual and quarterly financials for deeper analysis.
- Key Ratios: Profitability, leverage, and efficiency ratios to evaluate performance.
- Dashboard and Charts: Visual summaries of valuation outcomes and assumptions.
Disclaimer
All information, articles, and product details provided on this website are for general informational and educational purposes only. We do not claim any ownership over, nor do we intend to infringe upon, any trademarks, copyrights, logos, brand names, or other intellectual property mentioned or depicted on this site. Such intellectual property remains the property of its respective owners, and any references here are made solely for identification or informational purposes, without implying any affiliation, endorsement, or partnership.
We make no representations or warranties, express or implied, regarding the accuracy, completeness, or suitability of any content or products presented. Nothing on this website should be construed as legal, tax, investment, financial, medical, or other professional advice. In addition, no part of this site—including articles or product references—constitutes a solicitation, recommendation, endorsement, advertisement, or offer to buy or sell any securities, franchises, or other financial instruments, particularly in jurisdictions where such activity would be unlawful.
All content is of a general nature and may not address the specific circumstances of any individual or entity. It is not a substitute for professional advice or services. Any actions you take based on the information provided here are strictly at your own risk. You accept full responsibility for any decisions or outcomes arising from your use of this website and agree to release us from any liability in connection with your use of, or reliance upon, the content or products found herein.