
|
Bassett Furniture Industries, Incorporated (BSET) DCF Avaliação |
Totalmente Editável: Adapte-Se Às Suas Necessidades No Excel Ou Planilhas
Design Profissional: Modelos Confiáveis E Padrão Da Indústria
Pré-Construídos Para Uso Rápido E Eficiente
Compatível com MAC/PC, totalmente desbloqueado
Não É Necessária Experiência; Fácil De Seguir
Bassett Furniture Industries, Incorporated (BSET) Bundle
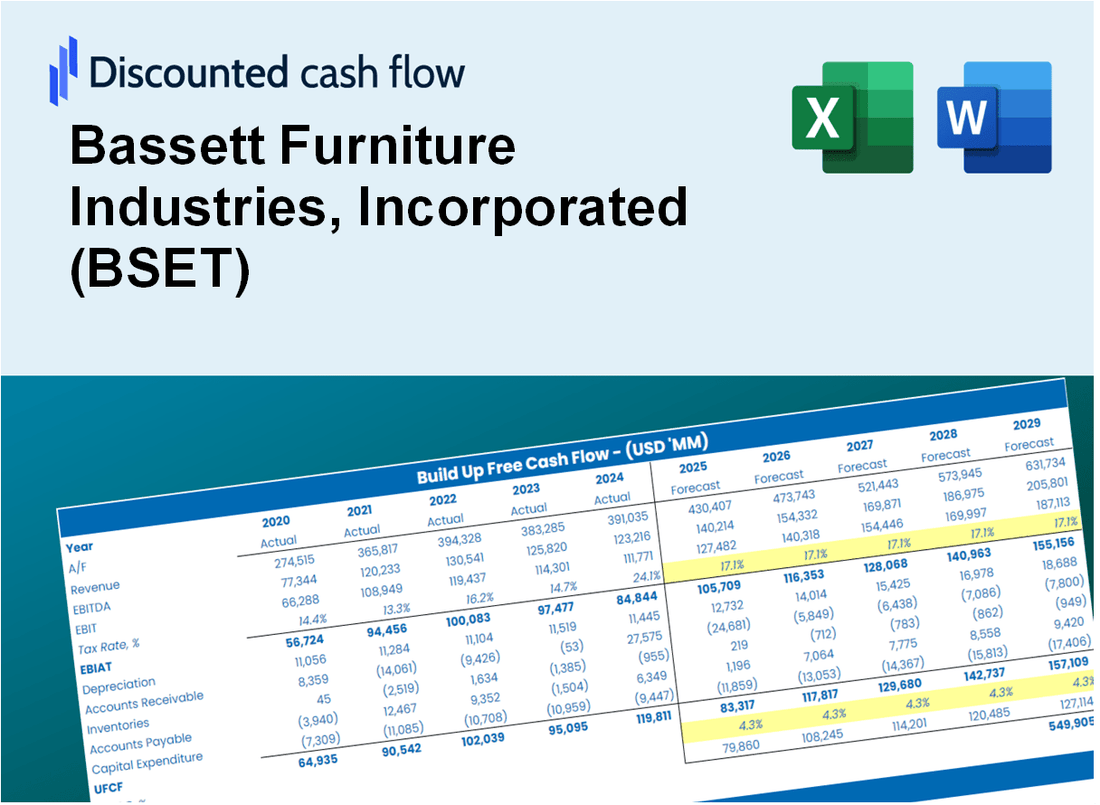
Simplifique as indústrias de móveis Bassett, Avaliação Incorporated (BSET) com esta calculadora DCF personalizável! Com o Real Bassett Financials e os insumos de previsão ajustável, você pode testar cenários e descobrir o valor justo de Bassett em minutos.
What You Will Receive
- Pre-Filled Financial Model: Utilizing Bassett Furniture's actual data for accurate DCF valuation.
- Comprehensive Forecast Control: Modify revenue growth, profit margins, WACC, and other essential factors.
- Real-Time Calculations: Automatic updates provide immediate feedback as you adjust parameters.
- Professional-Grade Template: A polished Excel file crafted for high-quality valuation analysis.
- Flexible and Reusable: Designed for adaptability, allowing for repeated application in detailed forecasting.
Key Features
- Customizable Market Assumptions: Adjust essential factors such as sales growth, profit margins, and capital investments.
- Instant DCF Calculation: Quickly computes intrinsic value, NPV, and additional financial metrics.
- Industry-Leading Precision: Incorporates Bassett Furniture's actual financial data for accurate valuation results.
- Effortless Scenario Testing: Evaluate various scenarios and analyze results with ease.
- Efficiency Booster: Streamline the valuation process without the hassle of creating complex models from the ground up.
How It Works
- Download: Obtain the pre-configured Excel file featuring Bassett Furniture Industries' (BSET) financial data.
- Customize: Modify projections, such as sales growth, EBITDA %, and WACC.
- Update Automatically: The intrinsic value and NPV calculations refresh in real-time.
- Test Scenarios: Develop various forecasts and instantly compare the results.
- Make Decisions: Leverage the valuation outcomes to inform your investment choices.
Why Choose Bassett Furniture Industries, Incorporated (BSET)?
- Quality Craftsmanship: Our furniture is built to last, ensuring durability and style in every piece.
- Wide Selection: From contemporary to traditional designs, we offer a diverse range of furniture to suit any taste.
- Custom Options: Personalize your furniture with a variety of fabrics, finishes, and configurations.
- Exceptional Customer Service: Our knowledgeable team is here to assist you every step of the way.
- Industry Leader: With decades of experience, we are trusted by customers and professionals alike.
Who Should Use Bassett Furniture Industries, Incorporated (BSET)?
- Homeowners: Enhance your living spaces with stylish and high-quality furniture options.
- Interior Designers: Access a wide range of customizable pieces to meet client needs.
- Retailers: Partner with a reputable brand to offer premium furniture selections.
- Investors: Evaluate the growth potential of a well-established company in the furniture market.
- Students and Educators: Utilize the brand's history and business model for case studies in marketing and design courses.
What the Template Contains
- Preloaded BSET Data: Historical and projected financial data, including revenue, EBIT, and capital expenditures.
- DCF and WACC Models: Professional-grade sheets for calculating intrinsic value and Weighted Average Cost of Capital.
- Editable Inputs: Yellow-highlighted cells for adjusting revenue growth, tax rates, and discount rates.
- Financial Statements: Comprehensive annual and quarterly financials for deeper analysis.
- Key Ratios: Profitability, leverage, and efficiency ratios to evaluate performance.
- Dashboard and Charts: Visual summaries of valuation outcomes and assumptions.
Disclaimer
All information, articles, and product details provided on this website are for general informational and educational purposes only. We do not claim any ownership over, nor do we intend to infringe upon, any trademarks, copyrights, logos, brand names, or other intellectual property mentioned or depicted on this site. Such intellectual property remains the property of its respective owners, and any references here are made solely for identification or informational purposes, without implying any affiliation, endorsement, or partnership.
We make no representations or warranties, express or implied, regarding the accuracy, completeness, or suitability of any content or products presented. Nothing on this website should be construed as legal, tax, investment, financial, medical, or other professional advice. In addition, no part of this site—including articles or product references—constitutes a solicitation, recommendation, endorsement, advertisement, or offer to buy or sell any securities, franchises, or other financial instruments, particularly in jurisdictions where such activity would be unlawful.
All content is of a general nature and may not address the specific circumstances of any individual or entity. It is not a substitute for professional advice or services. Any actions you take based on the information provided here are strictly at your own risk. You accept full responsibility for any decisions or outcomes arising from your use of this website and agree to release us from any liability in connection with your use of, or reliance upon, the content or products found herein.