
|
Beazer Homes USA, Inc. (BZH) Avaliação DCF |
Totalmente Editável: Adapte-Se Às Suas Necessidades No Excel Ou Planilhas
Design Profissional: Modelos Confiáveis E Padrão Da Indústria
Pré-Construídos Para Uso Rápido E Eficiente
Compatível com MAC/PC, totalmente desbloqueado
Não É Necessária Experiência; Fácil De Seguir
Beazer Homes USA, Inc. (BZH) Bundle
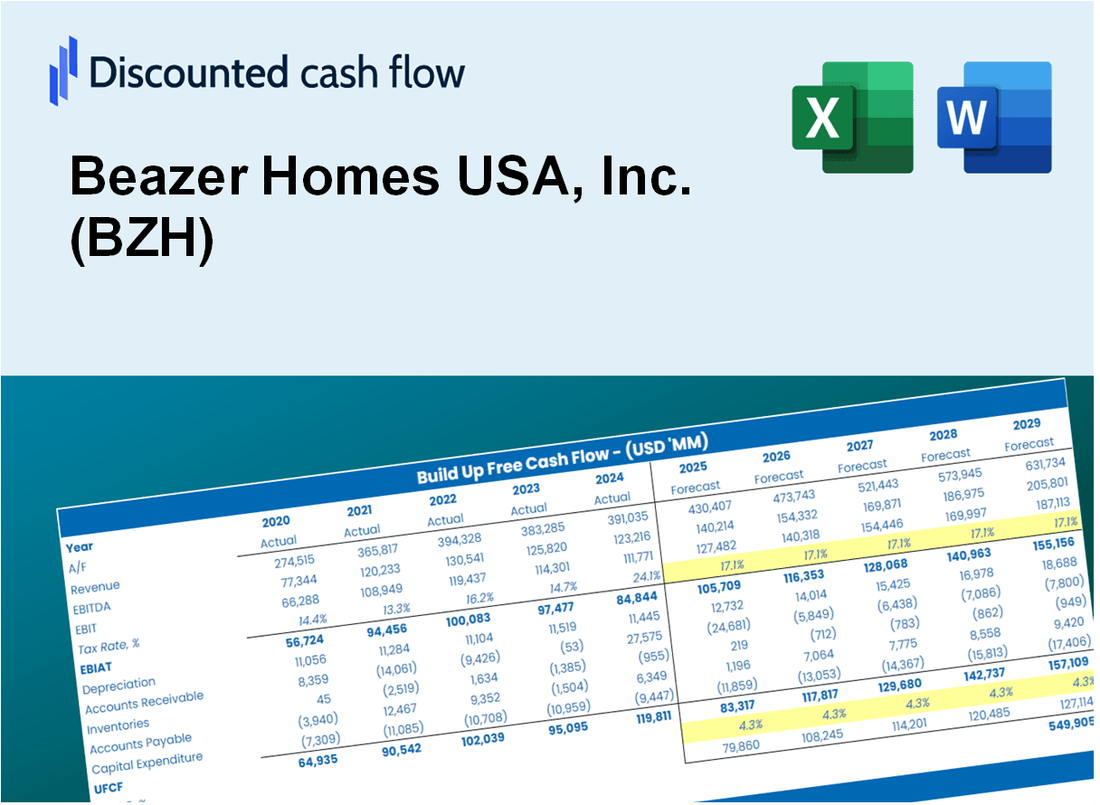
Projetado para precisão, nossa calculadora DCF [BZH] permite avaliar a avaliação da Beorm Homes USA, Inc. usando dados financeiros do mundo real, oferecendo flexibilidade completa para modificar todos os parâmetros essenciais para melhorar as projeções.
Discounted Cash Flow (DCF) - (USD MM)
| Year | AY1 2021 |
AY2 2022 |
AY3 2023 |
AY4 2024 |
AY5 2025 |
FY1 2026 |
FY2 2027 |
FY3 2028 |
FY4 2029 |
FY5 2030 |
|---|---|---|---|---|---|---|---|---|---|---|
| Revenue | 2,140.3 | 2,317.0 | 2,206.8 | 2,330.2 | 2,371.6 | 2,436.0 | 2,502.2 | 2,570.1 | 2,639.9 | 2,711.7 |
| Revenue Growth, % | 0 | 8.26 | -4.76 | 5.59 | 1.77 | 2.72 | 2.72 | 2.72 | 2.72 | 2.72 |
| EBITDA | 160.8 | 285.9 | 189.5 | 157.9 | 60.0 | 183.9 | 188.9 | 194.0 | 199.3 | 204.7 |
| EBITDA, % | 7.52 | 12.34 | 8.58 | 6.78 | 2.53 | 7.55 | 7.55 | 7.55 | 7.55 | 7.55 |
| Depreciation | 14.0 | 13.4 | 12.2 | 14.9 | 19.2 | 15.7 | 16.2 | 16.6 | 17.0 | 17.5 |
| Depreciation, % | 0.65299 | 0.57661 | 0.55275 | 0.63801 | 0.80825 | 0.64572 | 0.64572 | 0.64572 | 0.64572 | 0.64572 |
| EBIT | 146.9 | 272.5 | 177.3 | 143.0 | 40.9 | 168.2 | 172.7 | 177.4 | 182.2 | 187.2 |
| EBIT, % | 6.86 | 11.76 | 8.03 | 6.14 | 1.72 | 6.9 | 6.9 | 6.9 | 6.9 | 6.9 |
| Total Cash | 246.7 | 214.6 | 345.6 | 203.9 | 214.7 | 264.3 | 271.5 | 278.9 | 286.5 | 294.2 |
| Total Cash, percent | .0 | .0 | .0 | .0 | .0 | .0 | .0 | .0 | .0 | .0 |
| Account Receivables | 25.7 | 45.5 | 45.6 | 65.4 | 78.1 | 55.2 | 56.7 | 58.3 | 59.8 | 61.5 |
| Account Receivables, % | 1.2 | 1.96 | 2.07 | 2.81 | 3.3 | 2.27 | 2.27 | 2.27 | 2.27 | 2.27 |
| Inventories | 1,501.6 | 1,737.9 | 1,756.2 | 2,040.6 | 2,029.4 | 1,938.5 | 1,991.2 | 2,045.3 | 2,100.8 | 2,157.9 |
| Inventories, % | 70.16 | 75.01 | 79.58 | 87.57 | 85.57 | 79.58 | 79.58 | 79.58 | 79.58 | 79.58 |
| Accounts Payable | 133.4 | 143.6 | 154.3 | 164.4 | 143.5 | 158.5 | 162.8 | 167.2 | 171.7 | 176.4 |
| Accounts Payable, % | 6.23 | 6.2 | 6.99 | 7.05 | 6.05 | 6.51 | 6.51 | 6.51 | 6.51 | 6.51 |
| Capital Expenditure | -14.6 | -15.0 | -20.3 | -22.4 | -28.5 | -21.5 | -22.1 | -22.7 | -23.3 | -24.0 |
| Capital Expenditure, % | -0.68425 | -0.64946 | -0.92143 | -0.95928 | -1.2 | -0.88324 | -0.88324 | -0.88324 | -0.88324 | -0.88324 |
| Tax Rate, % | -11.6 | -11.6 | -11.6 | -11.6 | -11.6 | -11.6 | -11.6 | -11.6 | -11.6 | -11.6 |
| EBITAT | 124.7 | 219.5 | 153.9 | 126.0 | 45.6 | 148.1 | 152.1 | 156.3 | 160.5 | 164.9 |
| Depreciation | ||||||||||
| Changes in Account Receivables | ||||||||||
| Changes in Inventories | ||||||||||
| Changes in Accounts Payable | ||||||||||
| Capital Expenditure | ||||||||||
| UFCF | -1,269.9 | -28.0 | 138.0 | -175.6 | 13.8 | 271.2 | 96.3 | 99.0 | 101.6 | 104.4 |
| WACC, % | 13.98 | 13.98 | 13.98 | 13.98 | 13.98 | 13.98 | 13.98 | 13.98 | 13.98 | 13.98 |
| PV UFCF | ||||||||||
| SUM PV UFCF | 493.4 | |||||||||
| Long Term Growth Rate, % | 2.00 | |||||||||
| Free cash flow (T + 1) | 106 | |||||||||
| Terminal Value | 889 | |||||||||
| Present Terminal Value | 462 | |||||||||
| Enterprise Value | 956 | |||||||||
| Net Debt | -215 | |||||||||
| Equity Value | 1,170 | |||||||||
| Diluted Shares Outstanding, MM | 30 | |||||||||
| Equity Value Per Share | 39.00 |
What You Will Get
- Real BZH Financial Data: Pre-filled with Beazer Homes’ historical and projected data for precise analysis.
- Fully Editable Template: Modify key inputs like revenue growth, WACC, and EBITDA % with ease.
- Automatic Calculations: See Beazer Homes’ intrinsic value update instantly based on your changes.
- Professional Valuation Tool: Designed for investors, analysts, and consultants seeking accurate DCF results.
- User-Friendly Design: Simple structure and clear instructions for all experience levels.
Key Features
- Real Beazer Homes Financials: Access precise pre-loaded historical data and future projections for Beazer Homes USA, Inc. (BZH).
- Customizable Forecast Assumptions: Modify yellow-highlighted cells such as WACC, growth rates, and margins to fit your analysis.
- Dynamic Calculations: Automatic updates to DCF, Net Present Value (NPV), and cash flow analysis for accurate valuation.
- Visual Dashboard: User-friendly charts and summaries to effectively visualize your valuation results for Beazer Homes USA, Inc. (BZH).
- For Professionals and Beginners: An intuitive layout designed for investors, CFOs, and consultants alike.
How It Works
- Step 1: Download the Excel file for Beazer Homes USA, Inc. (BZH).
- Step 2: Review Beazer's pre-filled financial data and forecasts.
- Step 3: Adjust key inputs such as home sales growth, discount rates, and cost of goods sold (highlighted cells).
- Step 4: Observe the DCF model update in real-time as you modify your assumptions.
- Step 5: Evaluate the outputs and leverage the results for your investment strategies.
Why Choose This Calculator?
- Accurate Data: Real Beazer Homes financials ensure reliable valuation results.
- Customizable: Adjust key parameters like growth rates, WACC, and tax rates to match your projections.
- Time-Saving: Pre-built calculations eliminate the need to start from scratch.
- Professional-Grade Tool: Designed for investors, analysts, and consultants.
- User-Friendly: Intuitive layout and step-by-step instructions make it easy for all users.
Who Should Use Beazer Homes USA, Inc. (BZH)?
- Homebuyers: Make informed decisions with a trusted builder known for quality and value.
- Real Estate Investors: Analyze market trends and opportunities in residential construction.
- Realtors: Utilize Beazer Homes' offerings to enhance client options and presentations.
- Industry Analysts: Gain insights into the housing market with Beazer's comprehensive reports.
- Students and Educators: Explore practical applications of homebuilding concepts in academic settings.
What the Template Contains
- Operating and Balance Sheet Data: Pre-filled Beazer Homes USA, Inc. (BZH) historical data and forecasts, including revenue, EBITDA, EBIT, and capital expenditures.
- WACC Calculation: A dedicated sheet for Weighted Average Cost of Capital (WACC), featuring parameters such as Beta, risk-free rate, and share price.
- DCF Valuation (Unlevered and Levered): Editable Discounted Cash Flow models illustrating intrinsic value with comprehensive calculations.
- Financial Statements: Pre-loaded financial statements (annual and quarterly) to facilitate analysis.
- Key Ratios: Includes profitability, leverage, and efficiency ratios for Beazer Homes USA, Inc. (BZH).
- Dashboard and Charts: Visual summary of valuation outputs and assumptions for easy result analysis.
Disclaimer
All information, articles, and product details provided on this website are for general informational and educational purposes only. We do not claim any ownership over, nor do we intend to infringe upon, any trademarks, copyrights, logos, brand names, or other intellectual property mentioned or depicted on this site. Such intellectual property remains the property of its respective owners, and any references here are made solely for identification or informational purposes, without implying any affiliation, endorsement, or partnership.
We make no representations or warranties, express or implied, regarding the accuracy, completeness, or suitability of any content or products presented. Nothing on this website should be construed as legal, tax, investment, financial, medical, or other professional advice. In addition, no part of this site—including articles or product references—constitutes a solicitation, recommendation, endorsement, advertisement, or offer to buy or sell any securities, franchises, or other financial instruments, particularly in jurisdictions where such activity would be unlawful.
All content is of a general nature and may not address the specific circumstances of any individual or entity. It is not a substitute for professional advice or services. Any actions you take based on the information provided here are strictly at your own risk. You accept full responsibility for any decisions or outcomes arising from your use of this website and agree to release us from any liability in connection with your use of, or reliance upon, the content or products found herein.