
|
Avaliação DCF da China Automotive Systems, Inc. (CAAS) |
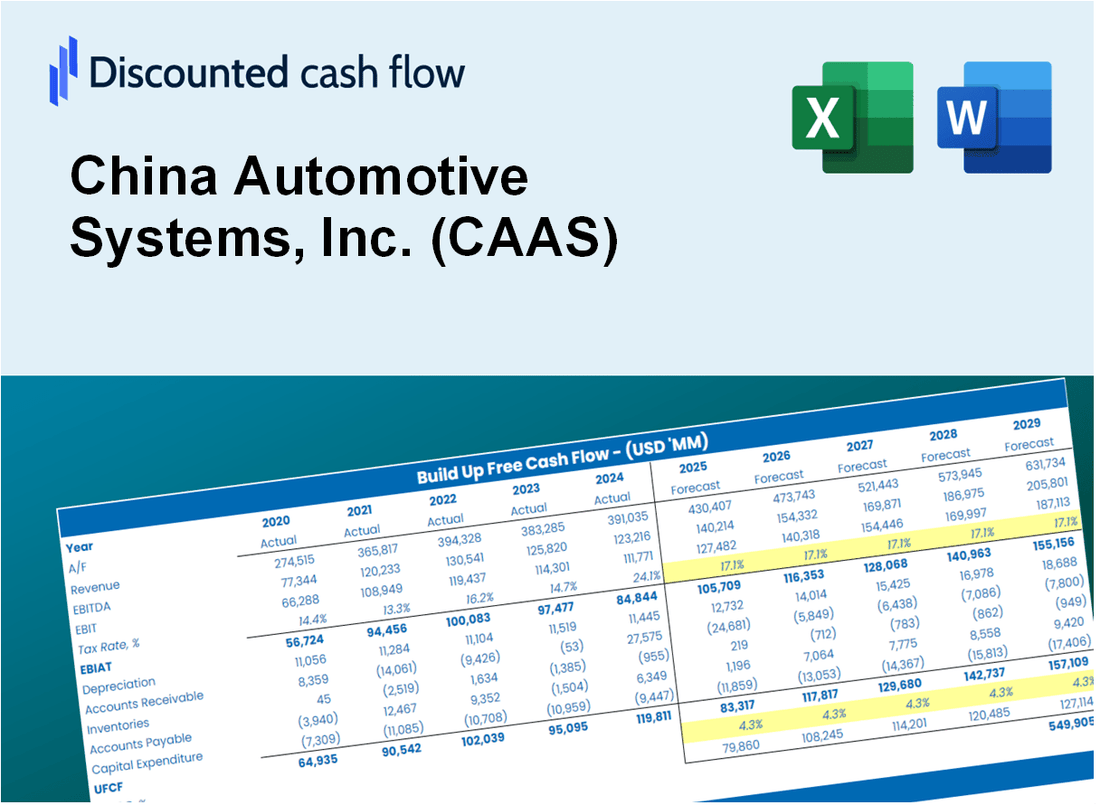
Totalmente Editável: Adapte-Se Às Suas Necessidades No Excel Ou Planilhas
Design Profissional: Modelos Confiáveis E Padrão Da Indústria
Pré-Construídos Para Uso Rápido E Eficiente
Compatível com MAC/PC, totalmente desbloqueado
Não É Necessária Experiência; Fácil De Seguir
China Automotive Systems, Inc. (CAAS) Bundle
Procurando avaliar o valor intrínseco da China Automotive Systems, Inc.? Nossa calculadora DCF (CAAS) integra dados do mundo real com recursos abrangentes de personalização, permitindo refinar suas previsões e aprimorar suas estratégias de investimento.
Discounted Cash Flow (DCF) - (USD MM)
| Year | AY1 2020 |
AY2 2021 |
AY3 2022 |
AY4 2023 |
AY5 2024 |
FY1 2025 |
FY2 2026 |
FY3 2027 |
FY4 2028 |
FY5 2029 |
|---|---|---|---|---|---|---|---|---|---|---|
| Revenue | 417.6 | 498.0 | 529.6 | 576.4 | 650.9 | 728.0 | 814.2 | 910.6 | 1,018.4 | 1,139.0 |
| Revenue Growth, % | 0 | 19.24 | 6.34 | 8.84 | 12.94 | 11.84 | 11.84 | 11.84 | 11.84 | 11.84 |
| EBITDA | 11.7 | 36.9 | 50.0 | 68.2 | 66.5 | 60.7 | 67.9 | 76.0 | 85.0 | 95.0 |
| EBITDA, % | 2.81 | 7.42 | 9.44 | 11.83 | 10.22 | 8.34 | 8.34 | 8.34 | 8.34 | 8.34 |
| Depreciation | 22.1 | 27.1 | 25.2 | 18.7 | 20.2 | 31.8 | 35.6 | 39.8 | 44.5 | 49.7 |
| Depreciation, % | 5.28 | 5.44 | 4.75 | 3.25 | 3.11 | 4.37 | 4.37 | 4.37 | 4.37 | 4.37 |
| EBIT | -10.3 | 9.8 | 24.8 | 49.5 | 46.3 | 28.9 | 32.4 | 36.2 | 40.5 | 45.3 |
| EBIT, % | -2.47 | 1.98 | 4.69 | 8.58 | 7.11 | 3.98 | 3.98 | 3.98 | 3.98 | 3.98 |
| Total Cash | 107.4 | 133.5 | 134.1 | 125.7 | 84.5 | 164.0 | 183.4 | 205.1 | 229.4 | 256.6 |
| Total Cash, percent | .0 | .0 | .0 | .0 | .0 | .0 | .0 | .0 | .0 | .0 |
| Account Receivables | 234.1 | 210.3 | 224.3 | 269.4 | 345.7 | 350.2 | 391.6 | 438.0 | 489.9 | 547.9 |
| Account Receivables, % | 56.06 | 42.24 | 42.36 | 46.74 | 53.11 | 48.1 | 48.1 | 48.1 | 48.1 | 48.1 |
| Inventories | 88.3 | 116.5 | 112.2 | 112.4 | 112.6 | 149.3 | 167.0 | 186.7 | 208.8 | 233.5 |
| Inventories, % | 21.15 | 23.39 | 21.19 | 19.5 | 17.29 | 20.51 | 20.51 | 20.51 | 20.51 | 20.51 |
| Accounts Payable | 145.1 | 146.1 | 150.6 | 160.6 | 197.0 | 219.3 | 245.3 | 274.3 | 306.8 | 343.1 |
| Accounts Payable, % | 34.74 | 29.33 | 28.43 | 27.86 | 30.27 | 30.13 | 30.13 | 30.13 | 30.13 | 30.13 |
| Capital Expenditure | -16.6 | -9.9 | -20.5 | -21.7 | -44.5 | -29.7 | -33.2 | -37.2 | -41.6 | -46.5 |
| Capital Expenditure, % | -3.97 | -1.99 | -3.87 | -3.76 | -6.83 | -4.08 | -4.08 | -4.08 | -4.08 | -4.08 |
| Tax Rate, % | 32.07 | 32.07 | 32.07 | 32.07 | 32.07 | 32.07 | 32.07 | 32.07 | 32.07 | 32.07 |
| EBITAT | -12.2 | 5.1 | 20.7 | 38.6 | 31.4 | 22.1 | 24.7 | 27.6 | 30.9 | 34.6 |
| Depreciation | ||||||||||
| Changes in Account Receivables | ||||||||||
| Changes in Inventories | ||||||||||
| Changes in Accounts Payable | ||||||||||
| Capital Expenditure | ||||||||||
| UFCF | -184.1 | 19.0 | 20.1 | .4 | -32.8 | 5.2 | -6.1 | -6.9 | -7.7 | -8.6 |
| WACC, % | 5.5 | 4.49 | 5.15 | 5.04 | 4.82 | 5 | 5 | 5 | 5 | 5 |
| PV UFCF | ||||||||||
| SUM PV UFCF | -19.6 | |||||||||
| Long Term Growth Rate, % | 3.50 | |||||||||
| Free cash flow (T + 1) | -9 | |||||||||
| Terminal Value | -593 | |||||||||
| Present Terminal Value | -465 | |||||||||
| Enterprise Value | -484 | |||||||||
| Net Debt | 112 | |||||||||
| Equity Value | -596 | |||||||||
| Diluted Shares Outstanding, MM | 30 | |||||||||
| Equity Value Per Share | -19.74 |
What You Will Get
- Real CAAS Financial Data: Pre-filled with China Automotive Systems, Inc.'s historical and projected data for precise analysis.
- Fully Editable Template: Modify key inputs like revenue growth, WACC, and EBITDA % with ease.
- Automatic Calculations: See CAAS's intrinsic value update instantly based on your changes.
- Professional Valuation Tool: Designed for investors, analysts, and consultants seeking accurate DCF results.
- User-Friendly Design: Simple structure and clear instructions for all experience levels.
Key Features
- Comprehensive DCF Calculator: Features detailed unlevered and levered DCF valuation models tailored for China Automotive Systems, Inc. (CAAS).
- WACC Calculator: Includes a pre-built Weighted Average Cost of Capital sheet with customizable inputs specific to the automotive industry.
- Customizable Forecast Assumptions: Adjust growth rates, capital expenditures, and discount rates to fit market conditions.
- Integrated Financial Ratios: Evaluate profitability, leverage, and efficiency ratios relevant to China Automotive Systems, Inc. (CAAS).
- Interactive Dashboard and Charts: Visual representations summarize key valuation metrics for straightforward analysis.
How It Works
- Step 1: Download the Excel file for China Automotive Systems, Inc. (CAAS).
- Step 2: Review CAAS’s pre-filled financial data and forecasts.
- Step 3: Adjust key inputs such as revenue growth, WACC, and tax rates (highlighted cells).
- Step 4: Observe the DCF model update in real-time as you modify assumptions.
- Step 5: Evaluate the outputs and leverage the results for your investment strategies.
Why Choose This Calculator for China Automotive Systems, Inc. (CAAS)?
- Accuracy: Utilizes real financial data from China Automotive Systems for precise calculations.
- Flexibility: Allows users to easily adjust and test various inputs to suit their needs.
- Time-Saving: Eliminate the need to create a DCF model from the ground up.
- Professional-Grade: Crafted with the expertise and precision expected at the CFO level.
- User-Friendly: Intuitive design ensures accessibility for users without extensive financial modeling skills.
Who Should Use This Product?
- Investors: Evaluate China Automotive Systems, Inc. (CAAS) for informed stock trading decisions.
- CFOs and Financial Analysts: Enhance valuation processes and validate financial forecasts for the automotive sector.
- Startup Founders: Gain insights into how automotive companies like China Automotive Systems, Inc. (CAAS) are valued.
- Consultants: Provide comprehensive valuation reports tailored for automotive clients.
- Students and Educators: Utilize real-world data from China Automotive Systems, Inc. (CAAS) to learn and teach valuation methodologies.
What the Template Contains
- Pre-Filled Data: Includes China Automotive Systems, Inc. (CAAS) historical financials and forecasts.
- Discounted Cash Flow Model: Editable DCF valuation model with automatic calculations.
- Weighted Average Cost of Capital (WACC): A dedicated sheet for calculating WACC based on custom inputs.
- Key Financial Ratios: Analyze China Automotive Systems, Inc. (CAAS) profitability, efficiency, and leverage.
- Customizable Inputs: Edit revenue growth, margins, and tax rates with ease.
- Clear Dashboard: Charts and tables summarizing key valuation results.
Disclaimer
All information, articles, and product details provided on this website are for general informational and educational purposes only. We do not claim any ownership over, nor do we intend to infringe upon, any trademarks, copyrights, logos, brand names, or other intellectual property mentioned or depicted on this site. Such intellectual property remains the property of its respective owners, and any references here are made solely for identification or informational purposes, without implying any affiliation, endorsement, or partnership.
We make no representations or warranties, express or implied, regarding the accuracy, completeness, or suitability of any content or products presented. Nothing on this website should be construed as legal, tax, investment, financial, medical, or other professional advice. In addition, no part of this site—including articles or product references—constitutes a solicitation, recommendation, endorsement, advertisement, or offer to buy or sell any securities, franchises, or other financial instruments, particularly in jurisdictions where such activity would be unlawful.
All content is of a general nature and may not address the specific circumstances of any individual or entity. It is not a substitute for professional advice or services. Any actions you take based on the information provided here are strictly at your own risk. You accept full responsibility for any decisions or outcomes arising from your use of this website and agree to release us from any liability in connection with your use of, or reliance upon, the content or products found herein.