
|
Calix, Inc. (Calx) Avaliação DCF |
Totalmente Editável: Adapte-Se Às Suas Necessidades No Excel Ou Planilhas
Design Profissional: Modelos Confiáveis E Padrão Da Indústria
Pré-Construídos Para Uso Rápido E Eficiente
Compatível com MAC/PC, totalmente desbloqueado
Não É Necessária Experiência; Fácil De Seguir
Calix, Inc. (CALX) Bundle
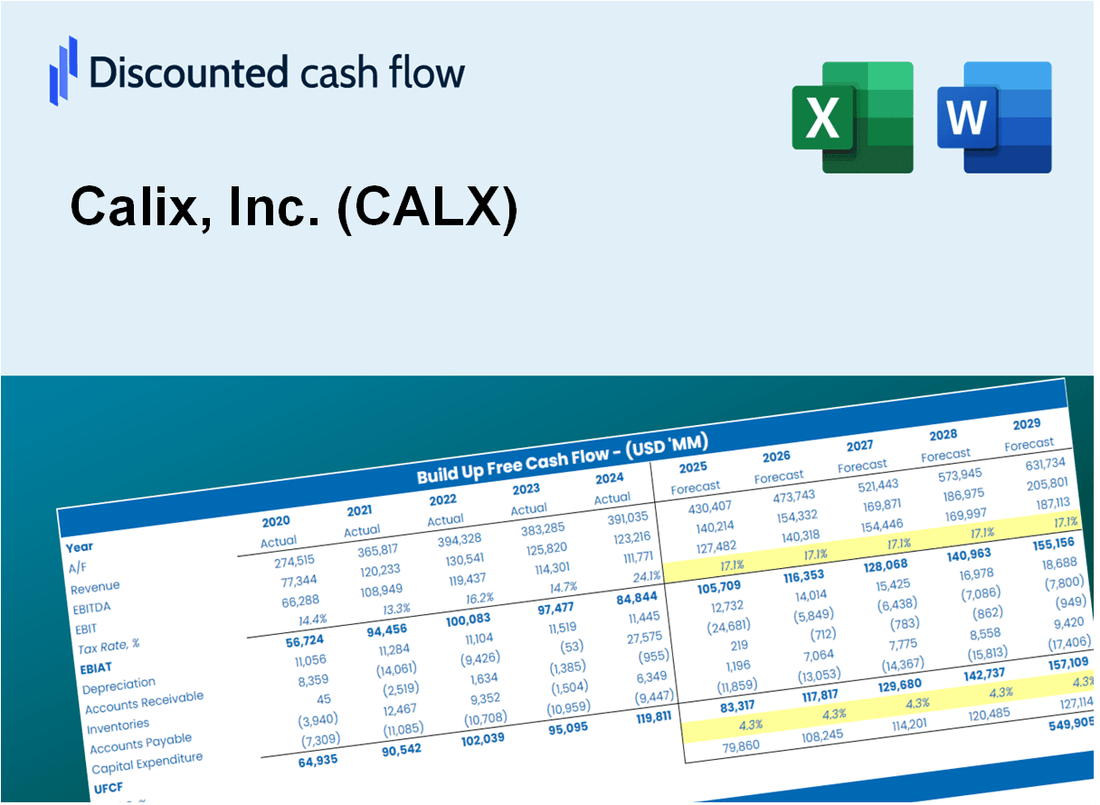
Projetado para precisão, nossa calculadora DCF (Calx) permite avaliar a avaliação da Calix, Inc. usando dados financeiros do mundo real, oferecendo flexibilidade completa para modificar todos os parâmetros essenciais para melhorar as projeções.
Discounted Cash Flow (DCF) - (USD MM)
| Year | AY1 2020 |
AY2 2021 |
AY3 2022 |
AY4 2023 |
AY5 2024 |
FY1 2025 |
FY2 2026 |
FY3 2027 |
FY4 2028 |
FY5 2029 |
|---|---|---|---|---|---|---|---|---|---|---|
| Revenue | 541.2 | 679.4 | 867.8 | 1,039.6 | 831.5 | 941.8 | 1,066.7 | 1,208.1 | 1,368.3 | 1,549.7 |
| Revenue Growth, % | 0 | 25.53 | 27.74 | 19.79 | -20.02 | 13.26 | 13.26 | 13.26 | 13.26 | 13.26 |
| EBITDA | 52.7 | 91.2 | 66.9 | 42.2 | -23.5 | 60.5 | 68.5 | 77.6 | 87.8 | 99.5 |
| EBITDA, % | 9.73 | 13.42 | 7.71 | 4.06 | -2.82 | 6.42 | 6.42 | 6.42 | 6.42 | 6.42 |
| Depreciation | 16.8 | 18.1 | 18.3 | 16.6 | 19.6 | 22.3 | 25.2 | 28.6 | 32.4 | 36.7 |
| Depreciation, % | 3.11 | 2.67 | 2.11 | 1.6 | 2.35 | 2.37 | 2.37 | 2.37 | 2.37 | 2.37 |
| EBIT | 35.9 | 73.1 | 48.6 | 25.6 | -43.0 | 38.2 | 43.2 | 49.0 | 55.5 | 62.8 |
| EBIT, % | 6.63 | 10.75 | 5.6 | 2.46 | -5.18 | 4.05 | 4.05 | 4.05 | 4.05 | 4.05 |
| Total Cash | 133.8 | 204.3 | 241.7 | 220.3 | 297.1 | 262.9 | 297.7 | 337.2 | 381.9 | 432.6 |
| Total Cash, percent | .0 | .0 | .0 | .0 | .0 | .0 | .0 | .0 | .0 | .0 |
| Account Receivables | 69.4 | 85.2 | 93.8 | 126.0 | 79.3 | 108.9 | 123.4 | 139.8 | 158.3 | 179.3 |
| Account Receivables, % | 12.83 | 12.54 | 10.81 | 12.12 | 9.54 | 11.57 | 11.57 | 11.57 | 11.57 | 11.57 |
| Inventories | 52.3 | 88.9 | 149.2 | 133.0 | 102.7 | 122.6 | 138.8 | 157.2 | 178.1 | 201.7 |
| Inventories, % | 9.66 | 13.08 | 17.19 | 12.79 | 12.35 | 13.01 | 13.01 | 13.01 | 13.01 | 13.01 |
| Accounts Payable | 13.1 | 29.1 | 41.4 | 34.7 | 20.2 | 32.5 | 36.8 | 41.7 | 47.2 | 53.5 |
| Accounts Payable, % | 2.42 | 4.28 | 4.77 | 3.34 | 2.43 | 3.45 | 3.45 | 3.45 | 3.45 | 3.45 |
| Capital Expenditure | -7.8 | -10.5 | -14.1 | -17.9 | -18.1 | -16.0 | -18.1 | -20.5 | -23.2 | -26.3 |
| Capital Expenditure, % | -1.44 | -1.54 | -1.62 | -1.72 | -2.17 | -1.7 | -1.7 | -1.7 | -1.7 | -1.7 |
| Tax Rate, % | 6 | 6 | 6 | 6 | 6 | 6 | 6 | 6 | 6 | 6 |
| EBITAT | 35.0 | 239.7 | 36.9 | 21.6 | -40.5 | 34.5 | 39.1 | 44.3 | 50.1 | 56.8 |
| Depreciation | ||||||||||
| Changes in Account Receivables | ||||||||||
| Changes in Inventories | ||||||||||
| Changes in Accounts Payable | ||||||||||
| Capital Expenditure | ||||||||||
| UFCF | -64.5 | 210.9 | -15.4 | -2.3 | 23.5 | 3.6 | 19.8 | 22.4 | 25.4 | 28.8 |
| WACC, % | 9.83 | 9.83 | 9.82 | 9.83 | 9.83 | 9.83 | 9.83 | 9.83 | 9.83 | 9.83 |
| PV UFCF | ||||||||||
| SUM PV UFCF | 72.1 | |||||||||
| Long Term Growth Rate, % | 4.00 | |||||||||
| Free cash flow (T + 1) | 30 | |||||||||
| Terminal Value | 514 | |||||||||
| Present Terminal Value | 322 | |||||||||
| Enterprise Value | 394 | |||||||||
| Net Debt | -35 | |||||||||
| Equity Value | 429 | |||||||||
| Diluted Shares Outstanding, MM | 66 | |||||||||
| Equity Value Per Share | 6.51 |
What You Will Get
- Editable Forecast Inputs: Easily modify key assumptions (growth %, margins, WACC) to explore various scenarios.
- Real-World Data: Calix, Inc.'s (CALX) financial data pre-loaded to accelerate your analysis.
- Automatic DCF Outputs: The template computes Net Present Value (NPV) and intrinsic value for you.
- Customizable and Professional: A refined Excel model tailored to meet your valuation requirements.
- Built for Analysts and Investors: Perfect for assessing projections, validating strategies, and enhancing efficiency.
Key Features
- Comprehensive CALX Data: Pre-loaded with Calix, Inc.'s historical financials and future growth forecasts.
- Customizable Assumptions: Modify revenue growth rates, profit margins, discount rates, tax implications, and capital investments.
- Interactive Valuation Framework: Instant updates to Net Present Value (NPV) and intrinsic value based on user inputs.
- What-If Analysis: Develop various forecast scenarios to evaluate different valuation possibilities.
- Intuitive Interface: Designed for ease of use, catering to both industry experts and newcomers.
How It Works
- Step 1: Download the prebuilt Excel template featuring Calix, Inc. (CALX) data.
- Step 2: Navigate through the pre-filled sheets to grasp the essential metrics.
- Step 3: Modify forecasts and assumptions in the editable yellow cells (WACC, growth, margins).
- Step 4: Instantly see the recalculated results, including Calix, Inc.'s (CALX) intrinsic value.
- Step 5: Make well-informed investment decisions or create reports based on the outputs.
Why Choose Calix, Inc. (CALX)?
- Streamlined Solutions: Access pre-built tools that eliminate the need for complex setups.
- Enhance Precision: Utilize verified data and methodologies to minimize valuation discrepancies.
- Fully Adaptable: Modify features to align with your unique business strategies and forecasts.
- User-Friendly Design: Intuitive visuals and outputs facilitate straightforward analysis.
- Endorsed by Industry Leaders: Crafted for professionals who prioritize accuracy and efficiency.
Who Should Use This Product?
- Individual Investors: Make informed decisions about buying or selling Calix, Inc. (CALX) stock.
- Financial Analysts: Streamline valuation processes with ready-to-use financial models specific to Calix, Inc. (CALX).
- Consultants: Deliver professional valuation insights on Calix, Inc. (CALX) to clients quickly and accurately.
- Business Owners: Understand how technology companies like Calix, Inc. (CALX) are valued to guide your own strategy.
- Finance Students: Learn valuation techniques using real-world data and scenarios related to Calix, Inc. (CALX).
What the Template Contains
- Pre-Filled DCF Model: Calix, Inc.’s (CALX) financial data preloaded for immediate use.
- WACC Calculator: Detailed calculations for Weighted Average Cost of Capital.
- Financial Ratios: Evaluate Calix, Inc.’s (CALX) profitability, leverage, and efficiency.
- Editable Inputs: Change assumptions such as growth, margins, and CAPEX to fit your scenarios.
- Financial Statements: Annual and quarterly reports to support detailed analysis.
- Interactive Dashboard: Easily visualize key valuation metrics and results.
Disclaimer
All information, articles, and product details provided on this website are for general informational and educational purposes only. We do not claim any ownership over, nor do we intend to infringe upon, any trademarks, copyrights, logos, brand names, or other intellectual property mentioned or depicted on this site. Such intellectual property remains the property of its respective owners, and any references here are made solely for identification or informational purposes, without implying any affiliation, endorsement, or partnership.
We make no representations or warranties, express or implied, regarding the accuracy, completeness, or suitability of any content or products presented. Nothing on this website should be construed as legal, tax, investment, financial, medical, or other professional advice. In addition, no part of this site—including articles or product references—constitutes a solicitation, recommendation, endorsement, advertisement, or offer to buy or sell any securities, franchises, or other financial instruments, particularly in jurisdictions where such activity would be unlawful.
All content is of a general nature and may not address the specific circumstances of any individual or entity. It is not a substitute for professional advice or services. Any actions you take based on the information provided here are strictly at your own risk. You accept full responsibility for any decisions or outcomes arising from your use of this website and agree to release us from any liability in connection with your use of, or reliance upon, the content or products found herein.