
|
Caplin Point Laboratories Limited (Caplipoint.NS) Avaliação DCF |
Totalmente Editável: Adapte-Se Às Suas Necessidades No Excel Ou Planilhas
Design Profissional: Modelos Confiáveis E Padrão Da Indústria
Pré-Construídos Para Uso Rápido E Eficiente
Compatível com MAC/PC, totalmente desbloqueado
Não É Necessária Experiência; Fácil De Seguir
Caplin Point Laboratories Limited (CAPLIPOINT.NS) Bundle
Explore o futuro financeiro da Caplin Point Laboratories Limited (Caplipointns) com nossa calculadora DCF amigável! Digite suas suposições de crescimento, margens e custos para calcular o valor intrínseco da Capplin Point Laboratories Limited (Caplipointns) e refine sua estratégia de investimento.
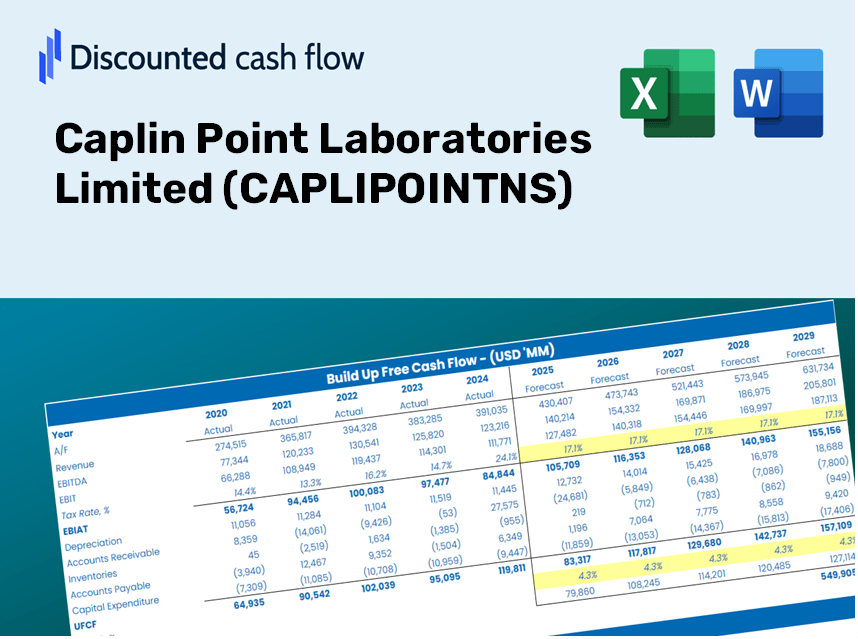
Discounted Cash Flow (DCF) - (USD MM)
| Year | AY1 2021 |
AY2 2022 |
AY3 2023 |
AY4 2024 |
AY5 2025 |
FY1 2026 |
FY2 2027 |
FY3 2028 |
FY4 2029 |
FY5 2030 |
|---|---|---|---|---|---|---|---|---|---|---|
| Revenue | 10,482.6 | 12,694.1 | 14,538.2 | 16,941.0 | 19,374.7 | 22,596.6 | 26,354.3 | 30,736.8 | 35,848.2 | 41,809.5 |
| Revenue Growth, % | 0 | 21.1 | 14.53 | 16.53 | 14.37 | 16.63 | 16.63 | 16.63 | 16.63 | 16.63 |
| EBITDA | 3,521.8 | 4,334.2 | 4,970.4 | 6,183.8 | 6,469.3 | 7,765.1 | 9,056.4 | 10,562.5 | 12,318.9 | 14,367.5 |
| EBITDA, % | 33.6 | 34.14 | 34.19 | 36.5 | 33.39 | 34.36 | 34.36 | 34.36 | 34.36 | 34.36 |
| Depreciation | 369.7 | 469.0 | 449.9 | 534.4 | 659.6 | 762.6 | 889.5 | 1,037.4 | 1,209.9 | 1,411.1 |
| Depreciation, % | 3.53 | 3.69 | 3.09 | 3.15 | 3.4 | 3.38 | 3.38 | 3.38 | 3.38 | 3.38 |
| EBIT | 3,152.1 | 3,865.2 | 4,520.5 | 5,649.4 | 5,809.7 | 7,002.5 | 8,167.0 | 9,525.1 | 11,109.1 | 12,956.4 |
| EBIT, % | 30.07 | 30.45 | 31.09 | 33.35 | 29.99 | 30.99 | 30.99 | 30.99 | 30.99 | 30.99 |
| Total Cash | 4,462.6 | 5,127.0 | 6,502.8 | 7,881.0 | 9,027.4 | 9,978.8 | 11,638.2 | 13,573.6 | 15,830.8 | 18,463.4 |
| Total Cash, percent | .0 | .0 | .0 | .0 | .0 | .0 | .0 | .0 | .0 | .0 |
| Account Receivables | 3,866.9 | 5,116.3 | 5,425.8 | 6,532.0 | 6,324.9 | 8,393.1 | 9,788.9 | 11,416.7 | 13,315.2 | 15,529.5 |
| Account Receivables, % | 36.89 | 40.3 | 37.32 | 38.56 | 32.65 | 37.14 | 37.14 | 37.14 | 37.14 | 37.14 |
| Inventories | 1,790.0 | 2,273.1 | 2,882.2 | 3,630.4 | 3,361.0 | 4,229.4 | 4,932.7 | 5,753.0 | 6,709.7 | 7,825.5 |
| Inventories, % | 17.08 | 17.91 | 19.83 | 21.43 | 17.35 | 18.72 | 18.72 | 18.72 | 18.72 | 18.72 |
| Accounts Payable | 885.0 | 1,631.8 | 1,525.6 | 2,094.1 | 2,175.8 | 2,502.9 | 2,919.1 | 3,404.6 | 3,970.7 | 4,631.0 |
| Accounts Payable, % | 8.44 | 12.85 | 10.49 | 12.36 | 11.23 | 11.08 | 11.08 | 11.08 | 11.08 | 11.08 |
| Capital Expenditure | -704.8 | -911.8 | -1,937.5 | -1,458.2 | -1,915.2 | -2,066.5 | -2,410.2 | -2,811.0 | -3,278.4 | -3,823.6 |
| Capital Expenditure, % | -6.72 | -7.18 | -13.33 | -8.61 | -9.89 | -9.15 | -9.15 | -9.15 | -9.15 | -9.15 |
| Tax Rate, % | 20.76 | 20.76 | 20.76 | 20.76 | 20.76 | 20.76 | 20.76 | 20.76 | 20.76 | 20.76 |
| EBITAT | 2,435.0 | 3,003.8 | 3,768.4 | 4,575.0 | 4,603.9 | 5,581.8 | 6,510.0 | 7,592.6 | 8,855.1 | 10,327.7 |
| Depreciation | ||||||||||
| Changes in Account Receivables | ||||||||||
| Changes in Inventories | ||||||||||
| Changes in Accounts Payable | ||||||||||
| Capital Expenditure | ||||||||||
| UFCF | -2,672.1 | 1,575.4 | 1,256.0 | 2,365.3 | 3,906.5 | 1,668.3 | 3,306.4 | 3,856.3 | 4,497.6 | 5,245.5 |
| WACC, % | 4.67 | 4.67 | 4.67 | 4.67 | 4.67 | 4.67 | 4.67 | 4.67 | 4.67 | 4.67 |
| PV UFCF | ||||||||||
| SUM PV UFCF | 15,899.1 | |||||||||
| Long Term Growth Rate, % | 3.50 | |||||||||
| Free cash flow (T + 1) | 5,429 | |||||||||
| Terminal Value | 465,761 | |||||||||
| Present Terminal Value | 370,803 | |||||||||
| Enterprise Value | 386,702 | |||||||||
| Net Debt | -5,864 | |||||||||
| Equity Value | 392,566 | |||||||||
| Diluted Shares Outstanding, MM | 76 | |||||||||
| Equity Value Per Share | 5,142.13 |
What You Will Receive
- Customizable Excel Template: A fully adjustable Excel-based DCF Calculator featuring pre-populated financial data for CAPLIPOINTNS.
- Comprehensive Data: Access to historical trends and future projections (highlighted in the yellow cells).
- Forecasting Flexibility: Adjust key assumptions such as revenue growth, EBITDA margin, and WACC.
- Instant Calculations: Quickly visualize how your inputs affect the valuation of Caplin Point Laboratories.
- Professional Resource: Designed for use by investors, CFOs, consultants, and financial analysts.
- Intuitive Layout: Organized for straightforward navigation, complete with step-by-step guidance.
Key Features
- Comprehensive Financial Data: Gain access to precise pre-loaded historical financials and future forecasts for Caplin Point Laboratories Limited (CAPLIPOINTNS).
- Adjustable Forecast Criteria: Modify the yellow-highlighted cells, including WACC, growth rates, and profit margins.
- Real-Time Calculations: Enjoy automatic updates for DCF, Net Present Value (NPV), and cash flow assessments.
- User-Friendly Dashboard: View easily interpretable charts and summaries for quick insights into your valuation outcomes.
- Suitable for All Skill Levels: Designed with a straightforward, intuitive layout for investors, CFOs, and consultants alike.
How It Functions
- Step 1: Download the Excel file for Caplin Point Laboratories Limited (CAPLIPOINTNS).
- Step 2: Examine the pre-filled financial data and projections for Caplin Point.
- Step 3: Adjust key inputs such as revenue growth, WACC, and tax rates (highlighted cells).
- Step 4: Observe the DCF model update in real-time as you change your assumptions.
- Step 5: Review the outputs and utilize the findings for your investment strategies.
Why Opt for This Calculator?
- Reliable Data: Access authentic Caplin Point Laboratories Limited (CAPLIPOINTNS) financials for trustworthy valuation insights.
- Flexible Options: Tailor essential parameters like growth rates, WACC, and tax rates to align with your forecasts.
- Efficient: Built-in calculations mean you can skip starting from the beginning.
- Professional-Quality Tool: Crafted for investors, analysts, and consultants in the field.
- Easy to Use: User-friendly design and clear step-by-step guidance ensure accessibility for everyone.
Who Can Benefit from This Product?
- Professional Investors: Develop comprehensive and trustworthy valuation models for portfolio assessments concerning Caplin Point Laboratories Limited (CAPLIPOINTNS).
- Corporate Finance Teams: Evaluate valuation scenarios to inform strategic decisions within the organization.
- Consultants and Advisors: Deliver precise valuation insights related to Caplin Point Laboratories Limited (CAPLIPOINTNS) for client consultations.
- Students and Educators: Utilize real-world data to enhance financial modeling skills in an academic setting.
- Pharmaceutical Enthusiasts: Gain a deeper understanding of how companies like Caplin Point Laboratories Limited (CAPLIPOINTNS) are assessed in the market.
Contents of the Template
- Pre-Filled Data: Features Caplin Point Laboratories Limited's historical financial performance and projections.
- Discounted Cash Flow Model: An editable DCF valuation model with automatic computation capabilities.
- Weighted Average Cost of Capital (WACC): A specialized sheet for calculating WACC using custom parameters.
- Key Financial Ratios: Evaluate Caplin Point's profitability, operational efficiency, and financial leverage.
- Customizable Inputs: Easily adjust revenue growth rates, profit margins, and tax rates.
- Clear Dashboard: Visual charts and tables that summarize essential valuation outcomes.
Disclaimer
All information, articles, and product details provided on this website are for general informational and educational purposes only. We do not claim any ownership over, nor do we intend to infringe upon, any trademarks, copyrights, logos, brand names, or other intellectual property mentioned or depicted on this site. Such intellectual property remains the property of its respective owners, and any references here are made solely for identification or informational purposes, without implying any affiliation, endorsement, or partnership.
We make no representations or warranties, express or implied, regarding the accuracy, completeness, or suitability of any content or products presented. Nothing on this website should be construed as legal, tax, investment, financial, medical, or other professional advice. In addition, no part of this site—including articles or product references—constitutes a solicitation, recommendation, endorsement, advertisement, or offer to buy or sell any securities, franchises, or other financial instruments, particularly in jurisdictions where such activity would be unlawful.
All content is of a general nature and may not address the specific circumstances of any individual or entity. It is not a substitute for professional advice or services. Any actions you take based on the information provided here are strictly at your own risk. You accept full responsibility for any decisions or outcomes arising from your use of this website and agree to release us from any liability in connection with your use of, or reliance upon, the content or products found herein.