
|
Carborundum Universal Limited (Carboruniv.NS) Avaliação DCF |
Totalmente Editável: Adapte-Se Às Suas Necessidades No Excel Ou Planilhas
Design Profissional: Modelos Confiáveis E Padrão Da Indústria
Pré-Construídos Para Uso Rápido E Eficiente
Compatível com MAC/PC, totalmente desbloqueado
Não É Necessária Experiência; Fácil De Seguir
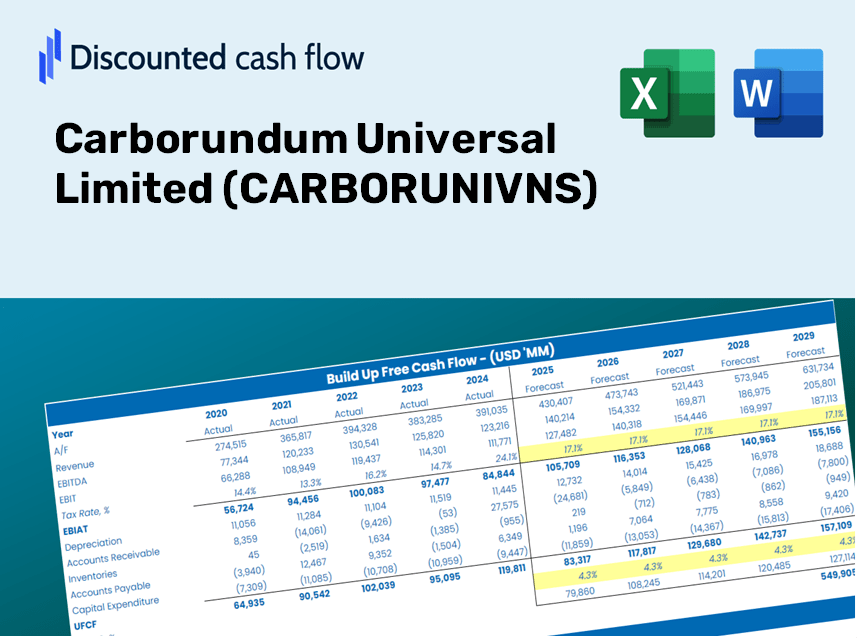
Carborundum Universal Limited (CARBORUNIV.NS) Bundle
Seja você um investidor ou analista, esta calculadora DCF (carborunivns) é o seu recurso preferido para uma avaliação precisa. Apresentando dados reais da Carborundum Universal Limited, você pode modificar as previsões e observar instantaneamente os resultados.
Discounted Cash Flow (DCF) - (USD MM)
| Year | AY1 2021 |
AY2 2022 |
AY3 2023 |
AY4 2024 |
AY5 2025 |
FY1 2026 |
FY2 2027 |
FY3 2028 |
FY4 2029 |
FY5 2030 |
|---|---|---|---|---|---|---|---|---|---|---|
| Revenue | 26,317.1 | 33,247.6 | 46,542.8 | 47,021.9 | 48,942.3 | 57,683.0 | 67,984.7 | 80,126.1 | 94,436.0 | 111,301.4 |
| Revenue Growth, % | 0 | 26.33 | 39.99 | 1.03 | 4.08 | 17.86 | 17.86 | 17.86 | 17.86 | 17.86 |
| EBITDA | 4,825.7 | 5,764.5 | 7,535.0 | 8,154.8 | 7,118.0 | 9,661.9 | 11,387.5 | 13,421.2 | 15,818.1 | 18,643.1 |
| EBITDA, % | 18.34 | 17.34 | 16.19 | 17.34 | 14.54 | 16.75 | 16.75 | 16.75 | 16.75 | 16.75 |
| Depreciation | 994.5 | 1,145.7 | 1,873.4 | 1,907.5 | 2,120.3 | 2,265.6 | 2,670.2 | 3,147.1 | 3,709.2 | 4,371.6 |
| Depreciation, % | 3.78 | 3.45 | 4.03 | 4.06 | 4.33 | 3.93 | 3.93 | 3.93 | 3.93 | 3.93 |
| EBIT | 3,831.2 | 4,618.8 | 5,661.6 | 6,247.3 | 4,997.7 | 7,396.3 | 8,717.2 | 10,274.1 | 12,108.9 | 14,271.5 |
| EBIT, % | 14.56 | 13.89 | 12.16 | 13.29 | 10.21 | 12.82 | 12.82 | 12.82 | 12.82 | 12.82 |
| Total Cash | 6,871.3 | 3,497.5 | 3,979.9 | 5,558.0 | 3,784.6 | 7,468.0 | 8,801.7 | 10,373.6 | 12,226.2 | 14,409.7 |
| Total Cash, percent | .0 | .0 | .0 | .0 | .0 | .0 | .0 | .0 | .0 | .0 |
| Account Receivables | 4,854.8 | 4,997.8 | 6,353.1 | 6,909.0 | 8,808.8 | 9,208.6 | 10,853.2 | 12,791.5 | 15,075.9 | 17,768.3 |
| Account Receivables, % | 18.45 | 15.03 | 13.65 | 14.69 | 18 | 15.96 | 15.96 | 15.96 | 15.96 | 15.96 |
| Inventories | 4,605.2 | 6,909.0 | 8,989.2 | 8,501.7 | 10,550.0 | 11,217.0 | 13,220.2 | 15,581.3 | 18,364.0 | 21,643.6 |
| Inventories, % | 17.5 | 20.78 | 19.31 | 18.08 | 21.56 | 19.45 | 19.45 | 19.45 | 19.45 | 19.45 |
| Accounts Payable | 3,031.1 | 3,703.6 | 3,359.1 | 3,977.7 | 3,498.4 | 5,247.0 | 6,184.1 | 7,288.5 | 8,590.1 | 10,124.3 |
| Accounts Payable, % | 11.52 | 11.14 | 7.22 | 8.46 | 7.15 | 9.1 | 9.1 | 9.1 | 9.1 | 9.1 |
| Capital Expenditure | -1,064.4 | -5,611.2 | -3,017.4 | -2,193.7 | -2,740.5 | -4,345.8 | -5,121.9 | -6,036.6 | -7,114.7 | -8,385.3 |
| Capital Expenditure, % | -4.04 | -16.88 | -6.48 | -4.67 | -5.6 | -7.53 | -7.53 | -7.53 | -7.53 | -7.53 |
| Tax Rate, % | 37.43 | 37.43 | 37.43 | 37.43 | 37.43 | 37.43 | 37.43 | 37.43 | 37.43 | 37.43 |
| EBITAT | 2,760.2 | 3,231.0 | 4,041.7 | 4,431.5 | 3,127.0 | 5,131.4 | 6,047.8 | 7,127.9 | 8,400.9 | 9,901.2 |
| Depreciation | ||||||||||
| Changes in Account Receivables | ||||||||||
| Changes in Inventories | ||||||||||
| Changes in Accounts Payable | ||||||||||
| Capital Expenditure | ||||||||||
| UFCF | -3,738.6 | -3,008.9 | -882.3 | 4,695.5 | -1,920.6 | 3,733.1 | 885.4 | 1,043.5 | 1,229.9 | 1,449.5 |
| WACC, % | 5.39 | 5.38 | 5.39 | 5.39 | 5.38 | 5.38 | 5.38 | 5.38 | 5.38 | 5.38 |
| PV UFCF | ||||||||||
| SUM PV UFCF | 7,343.6 | |||||||||
| Long Term Growth Rate, % | 4.00 | |||||||||
| Free cash flow (T + 1) | 1,508 | |||||||||
| Terminal Value | 108,903 | |||||||||
| Present Terminal Value | 83,784 | |||||||||
| Enterprise Value | 91,128 | |||||||||
| Net Debt | -1,642 | |||||||||
| Equity Value | 92,770 | |||||||||
| Diluted Shares Outstanding, MM | 188 | |||||||||
| Equity Value Per Share | 492.78 |
What You Will Receive
- Authentic CARBORUNIVNS Financials: Access historical and projected data for precise valuation.
- Customizable Parameters: Adjust WACC, tax rates, revenue growth, and capital expenditures as needed.
- Real-Time Calculations: Intrinsic value and NPV are computed automatically.
- Scenario Analysis: Explore various scenarios to assess Carborundum's future performance.
- User-Friendly and Professional Design: Created for experts while remaining approachable for newcomers.
Key Features
- Accurate Financial Data: Access reliable pre-loaded historical figures and future forecasts for Carborundum Universal Limited (CARBORUNIVNS).
- Adjustable Forecast Parameters: Modify yellow-highlighted cells such as WACC, growth rates, and profit margins to suit your analysis.
- Real-Time Calculations: Automatic recalculations for DCF, Net Present Value (NPV), and cash flow assessments.
- User-Friendly Visual Dashboard: Intuitive charts and summaries to help you easily comprehend your valuation outcomes.
- Suitable for All Levels: A straightforward and user-friendly layout designed for investors, CFOs, and consultants alike.
How It Functions
- 1. Access the Template: Download and open the Excel file containing Carborundum Universal Limited’s (CARBORUNIVNS) preloaded data.
- 2. Modify Assumptions: Adjust essential inputs such as growth rates, WACC, and capital expenditures.
- 3. Instant Results: The DCF model automatically calculates the intrinsic value and NPV.
- 4. Evaluate Scenarios: Analyze various forecasts to compare different valuation outcomes.
- 5. Present with Assurance: Provide professional valuation insights to inform your decisions.
Why Choose the Carborundum Universal Limited (CARBORUNIVNS) Calculator?
- Time Efficient: Get started immediately with a pre-built DCF model – no setup required.
- Enhanced Accuracy: Utilize dependable financial data and formulas to minimize valuation errors.
- Completely Customizable: Adjust the model to align with your specific assumptions and forecasts.
- Simple to Analyze: Intuitive charts and output make interpreting results straightforward.
- Endorsed by Professionals: Crafted for industry experts who prioritize accuracy and functionality.
Who Can Benefit from This Product?
- Individual Investors: Gain insights to make informed choices regarding the purchase or sale of Carborundum Universal Limited (CARBORUNIVNS) shares.
- Financial Analysts: Enhance your valuation processes with intuitive financial models designed for Carborundum Universal Limited (CARBORUNIVNS).
- Consultants: Provide clients with precise valuation analyses for Carborundum Universal Limited (CARBORUNIVNS) efficiently and effectively.
- Business Owners: Learn how major corporations like Carborundum Universal Limited (CARBORUNIVNS) are valued to inform your business strategies.
- Finance Students: Explore real-world data and scenarios to master valuation techniques relevant to Carborundum Universal Limited (CARBORUNIVNS).
Components of the Template
- Preloaded CARBORUNIVNS Data: Historical and projected financial metrics, encompassing revenue, EBIT, and capital expenditures.
- DCF and WACC Models: High-quality spreadsheets designed for calculating intrinsic value and Weighted Average Cost of Capital.
- Editable Inputs: Cells highlighted in yellow for modifying revenue growth estimates, tax rates, and discount rates.
- Financial Statements: Detailed annual and quarterly financial reports for in-depth analysis.
- Key Ratios: Metrics for profitability, leverage, and efficiency to assess company performance.
- Dashboard and Charts: Visual representations of valuation results and underlying assumptions.
Disclaimer
All information, articles, and product details provided on this website are for general informational and educational purposes only. We do not claim any ownership over, nor do we intend to infringe upon, any trademarks, copyrights, logos, brand names, or other intellectual property mentioned or depicted on this site. Such intellectual property remains the property of its respective owners, and any references here are made solely for identification or informational purposes, without implying any affiliation, endorsement, or partnership.
We make no representations or warranties, express or implied, regarding the accuracy, completeness, or suitability of any content or products presented. Nothing on this website should be construed as legal, tax, investment, financial, medical, or other professional advice. In addition, no part of this site—including articles or product references—constitutes a solicitation, recommendation, endorsement, advertisement, or offer to buy or sell any securities, franchises, or other financial instruments, particularly in jurisdictions where such activity would be unlawful.
All content is of a general nature and may not address the specific circumstances of any individual or entity. It is not a substitute for professional advice or services. Any actions you take based on the information provided here are strictly at your own risk. You accept full responsibility for any decisions or outcomes arising from your use of this website and agree to release us from any liability in connection with your use of, or reliance upon, the content or products found herein.